U-TURN IN INTEREST RATES?

EMR July 2024

Dear Reader

ATTITUDES OF CENTRAL BANKS

The latest actions by central banks are indeed astonishing. On 8 June 2024, the Neue Zürcher Zeitung wrote: “It rarely happens, for once the Europeans are ahead of the Americans”, citing the interest rate cuts by the Swiss National Bank and the European Central Bank. To make the connection clearer, it was the Swiss National Bank that was the first major central bank to announce an imminent turnaround, on 21 March 2024. The cut in the key interest rate by 25 basis points to 1.5% initially led to a depreciation of the CHF by 1% against the EUR. In the same period, the CHF fell by 1.2% against the USD, while the SMI rose by 0.9%. At the same time, the yield on 1-year Swiss government bonds fell by more than 20 basis points, from 1.22% to 0.99%. On 21 June 2024, the SNB confirmed the “interest rate turnaround” by lowering the interest rate again by 0.5 percentage points to 1.25%. This step confirms our assessment – for Switzerland – of how important currency changes are and can be.

On 8 June 2024, the European Central Bank (ECB) decided to change course, i.e. cut interest rates. The key interest rate was lowered by 0.25 percentage points to 4.25%. The ECB is thus following the example of the central banks in Canada, Switzerland and Sweden, which had lowered interest rates. The US Federal Reserve Board, on the other hand, decided on 12 June 2024 to postpone a reduction in the key interest rate. Chairman Powell announced that the Federal Reserve would maintain interest rates in their current range of 5.25% to 5.5%. At the same time, the forecast for interest rate cuts was revised to just one in 2024. The central bank’s policymakers noted that there had been “modest further progress” towards its 2% in-flation target. The chairman of the Federal Reserve stated during the press conference that the central bank did not yet have the confidence to cut interest rates even if inflation came back from its peak.

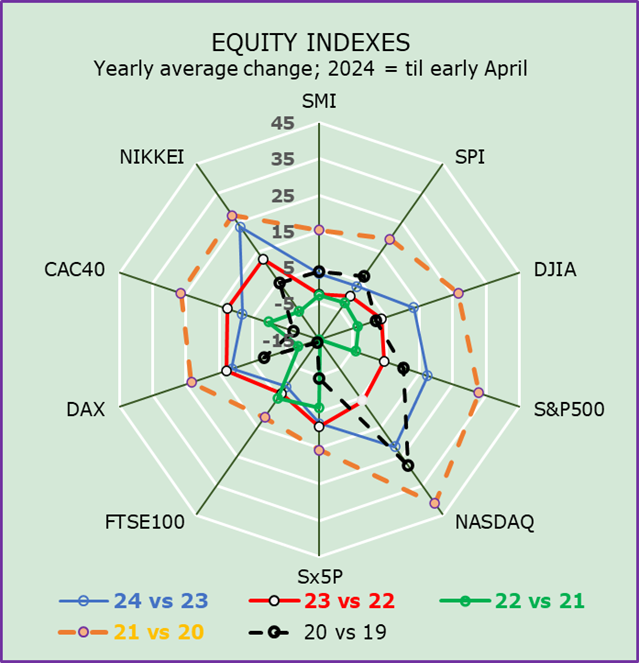
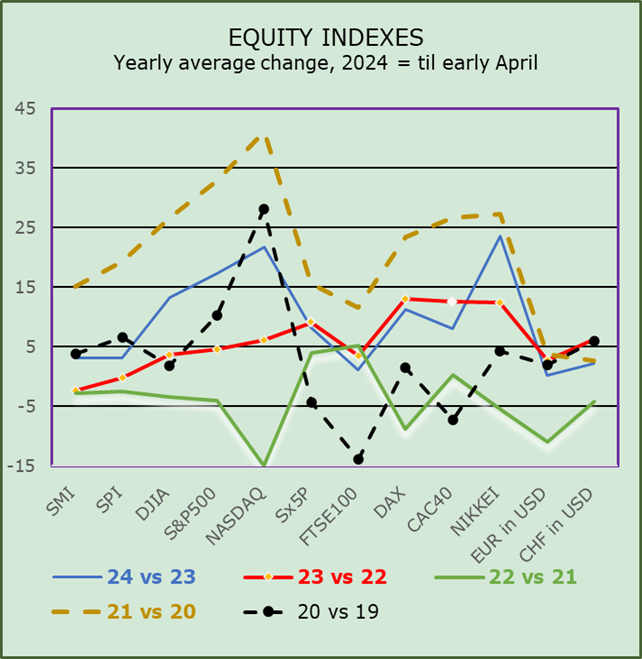
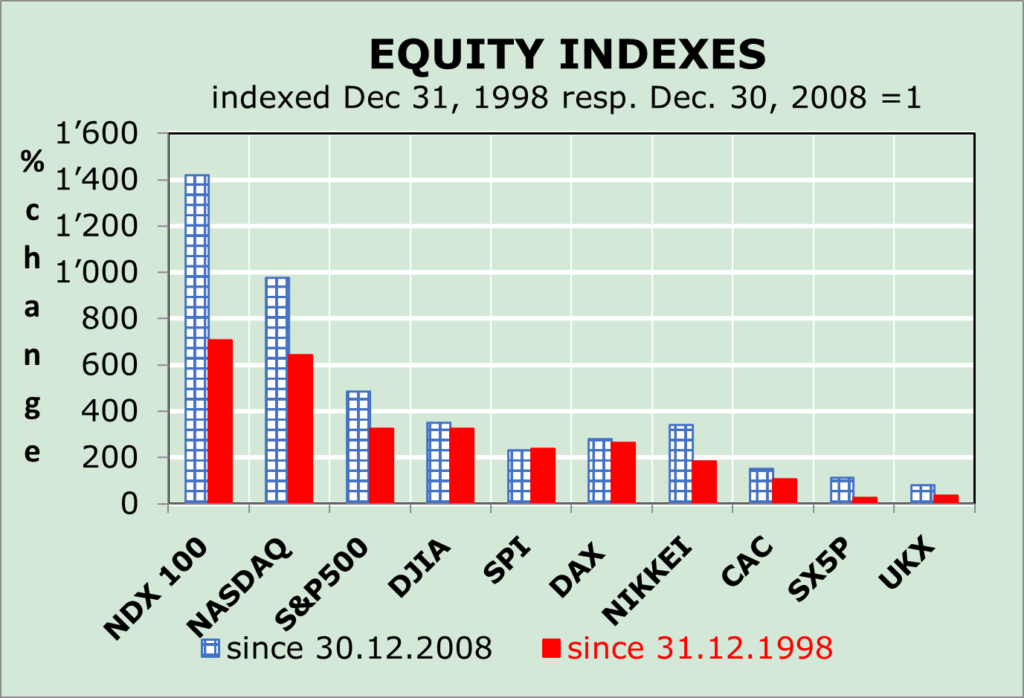
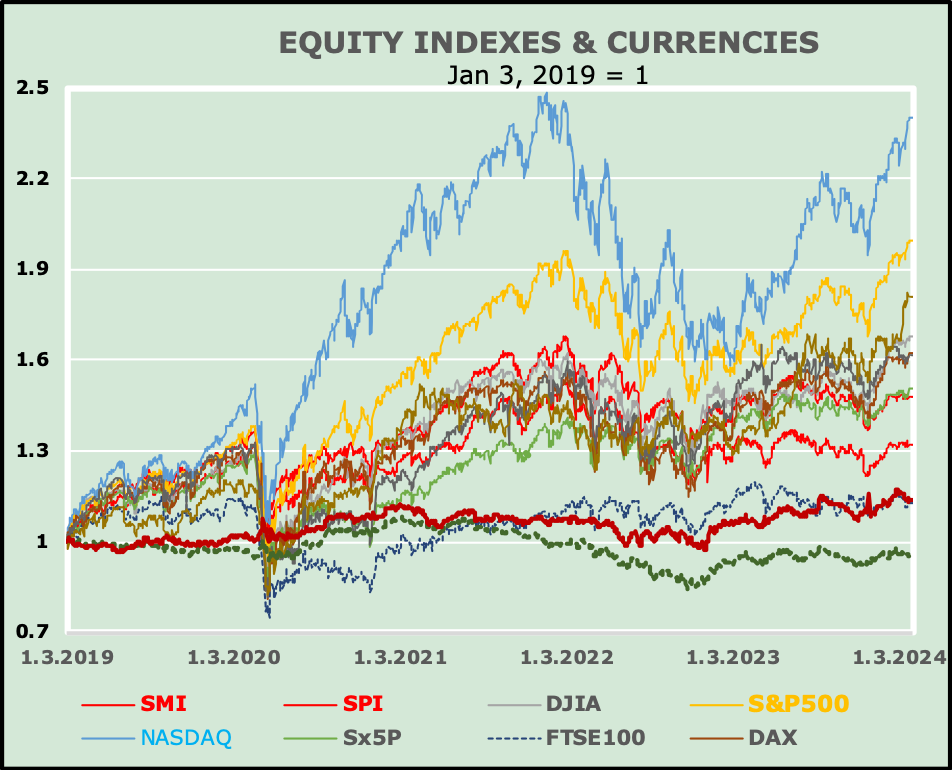
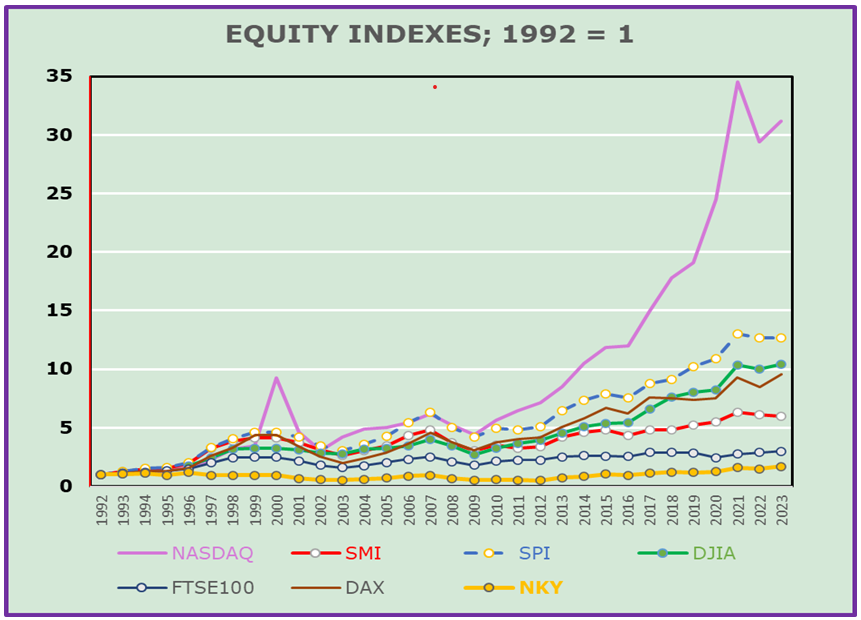
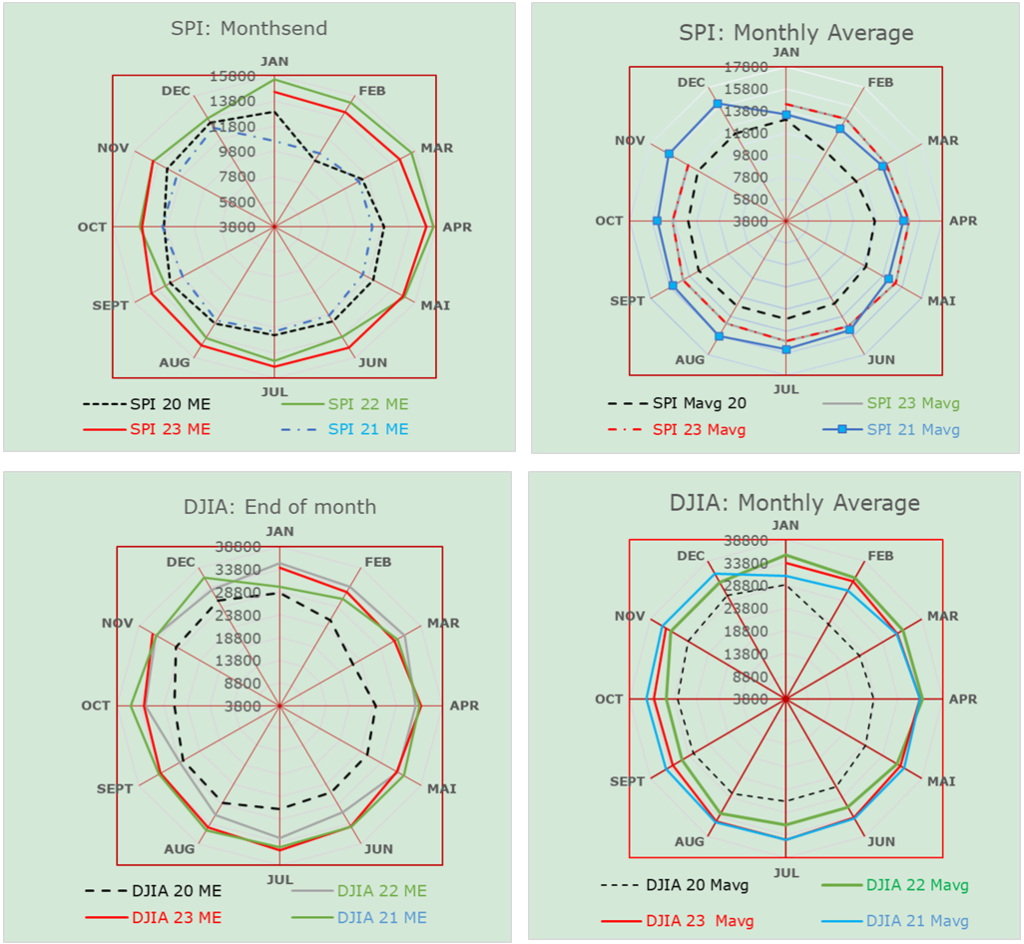
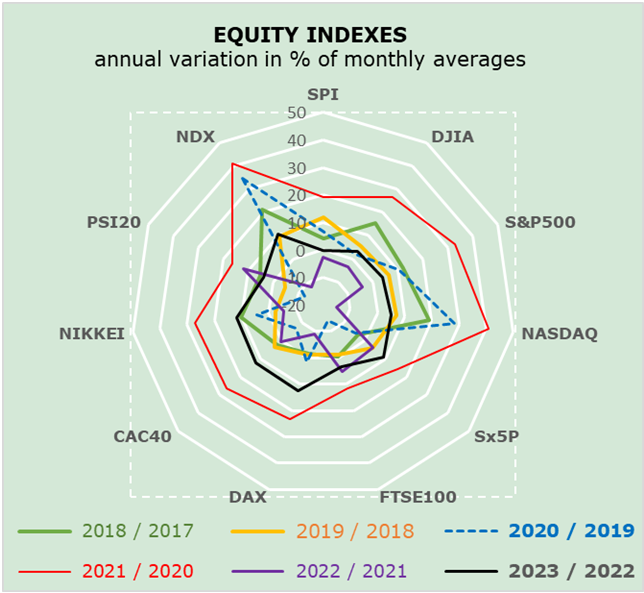
What do the developments of share indices indicate for the period since the end of 2021? The following chart points to two quite similar developments. The first refers to the period of the Covid pandemic, which peaked in late 2021 to early 2022, followed by a significant correction phase until the end of 2022. The second phase, which is similar to the first and extends from the end of 2022 to 2024, shows a fairly similar development. However, the growth rate of the equity indices, particularly the NDX, NASDAQ, NIKKEI and S&P500 compared to all other indi-ces, is revealing in the second phase. What conclusions can be drawn from these develop-ments is the real question at this point. Do you have any suggestions?

As the chart implicitly shows, it is impossible to explain why inflation can be contained pri-marily through interest rate cuts. What caused the correction in 2022 and the subsequent re-covery since the beginning of 2023 is the difficult contextual question?

Despite the rampant economic pessimism, share indices have recently reached new highs again. At this point, we would like to call the reader’s attention to a rather positive effect – the so-called “quantitative tightening” – a little-noticed approach, that is increasingly playing a decisive role on stock markets. This process is referred to as “buybacks”. Companies are increasingly buying up their own shares on the market. One might ask what effects these measures have or could have? A first answer that comes to mind, is undoubtedly the rise in share prices. Buying treasury shares on the market is reflected in higher earnings per share (EPS). These actions clearly point to high returns and prompt other market participants to take coherent action. It is indeed instructive to know how these developments play out. When the number of shares on the market is reduced, earnings per share increase, regardless of economic expectations. “Scarcer shares are the order of the day”.

As we know, there is another advantage: Buybacks are de facto an indirect form of remuner-ation for shareholders. The taxes due are delayed until the time the corresponding capital gain is realized, at a lower tax rate than dividends and at a time of the shareholder´s choos-ing.

Another important message relates to the prospect of a future, beyond the rampant negati-vism regarding inflation and lower expectations for economic activity. In this context, the question arises as to whether this attitude is not also relevant for the valuation of most major technology stocks. Let’s define this context as “corporate quantitative easing”! At this point, we wonder what the difference is between corporate quantitative easing and central bank quantitative tightening is – or ought to be. In other words, we ask ourselves which are the causes of the sharp rise in most technology stocks? Can we speak of technology-driven quan-titative easing? In the current environment, investors need to take a clear stance, because the quantitative tightening of central banks contrasts with the increase in liquidity available to shareholders in the market. In other words: Will politics prevail in the financial markets over increased liquidity? In this context, there is an interesting answer: The amounts that central banks withdraw from their own balance sheets flow into the financial markets through the windows of the buyback programs!

SHORT-TERM ASSESSMENT

As we write the July EMR, a so-called “tariff war” is imminent at a global level. When as-sessing the possible consequences of current events, we are reminded of the so-called tariff war that has raged at a global level in the past. In addition, recently, the press reports that the USA, Japan and South Korea are exerting increasing pressure on China to control exports of semiconductor technology and to co-operate in key sectors. What consequences this be-havior may have for the economy remains a difficult question.

An initial impact concerns the increase in prices for electric vehicles from China. As a result of the recently announced change, tariffs in Europe have risen by 38%, in addition to the 10% already in force. The increase in the United States is reported to be 102.5%. This politi-cal stance is currently being labelled as “economic self-destruction”. Let’s not forget that the International Monetary Fund found in 2019, based on data from 151 countries in the period from 1963 to 2014, that the introduction of measures to increase tariffs leads to negative effects on production volumes and productivity!

Given the ambivalent outlook, the conflicting expectations on the political front do not bode well. At this point, we could argue that Swiss investors could benefit from a significant home bias, mainly driven by a strong currency.

Suggestions are welcome.

Facebooktwitterlinkedinmail

CORPORATE QUANTITATIVE EASING?

EMR June 2024

Dear Reader

TRICKY EXERCISE IN AN ELECTION YEAR?

With regard to short- and medium-term expectations, most forecasts can be described as rather pessimistic. We believe that they can neither be considered promising nor relatively coherent. In this EMR, we will focus on the average developments of various stock indices in order to derive a likely, realistic outlook.

The following graphical representation of selected share indices speaks for itself. The changes in the shown indices indicate a clear dichotomy between the US indices, as well as partly also for Japan and all other indices. One specific and relevant conclusion that can be drown from the graph, for the current year 2024, relates to the most obvious disparities. In our opinion, there is little doubt that technological differences and currency changes have played – and will continue to play, a significant role in country allocation.

The annual growth rates differ considerably from index to index. One may wonder whether this is not a deterministic indication of the effects of the respective explanatory variables. The particular determinants should indeed be analyzed in detail and specifically as they do not have the same, coherent impacts. In terms of forecasting, we believe that this approach is indeed crucial. We assume that the result of the upcoming US presidential elections could pose particular problems of interpretation.

At this stage, we assume that the upcoming US presidential elections will once again play a decisive role. When interpreting the chart of the DJIA over a fairly long period of time, two quite different deterministic developments stand out. The first one ranging from 1945 to the end of the 1980s. In this period the trend has been relatively stable and somewhat monotonic in terms of the relevant definitions: “year start”, “year high” and “year close”. On the other hand, the divergence since the beginning of the 1990s is indeed astonishing and very revealing, isn’t it? The long-term, historical comparison remains a very delicate matter. One may ask him/her whether the slogan “as the US market goes, so go most industrial markets” is still valid and deterministic? If you answer yes (or no) to our question, we would appreciate it if you could tell us why so?

WALLSTREET IN THE ELECTION YEAR

When analyzing the available data on US election years since the early 1980s, one comes across a rather surprising piece of information. One may wonder whether the US presidential election in 2024 could prove to be a significant market-moving catalyst, as it has in previous periods, or whether it will go almost unnoticed, despite the media’s loud jargon. Barring an extraordinary development, this year’s presidential race looks like a repeat of the 2020 election except that the White House, Senate and House of Representatives may each flip to the other party with no “clear sweep” that would give either party unbridled power. At the moment, one may ask, what have been the real determinants to focus on in order to make a credible prediction?

First of all, they point to rather subdued economic growth in the first six months of the year, hopefully followed by an upswing, depending on the outcome, i.e. the majority of the winning party. Since the first US president, George Washington, was elected in 1789, there have been 59 elections. In the context of investments, investor preferences must be taken into account, which should hardly be easy! Will the result be similar to that of the 2020 election, i.e. simply a reversal from Biden to Trump, or will Biden follow Biden, remains the difficult question. At this point, it should not be underestimated that the respective market developments under the Trump and the Biden administration have not been as different as is widely assumed, possible because the Republican party retained the House of Representatives where all money bills must originate.

SHORT-TERM ASSESSMENT

Recently, many equity indexes have reached new all-time highs, while the macroeconomic outlook has remained subdued. This scenario is indeed surprising, especially when looking at the evolution of central banks’ balance sheets, which continue to focus on quantitative easing to reduce market liquidity and finally (or hopefully) to bring inflation under control! The main aim of the current policy is to “reduce securities liquidity” in order to bring inflation under control. Initially US banks, but increasingly also European banks, have started to buy their own shares on the market. It should be emphasized that not many analysts are talking or writing about this policy course. At this point, the question arises as to the purpose or objective of this policy and what impact it could have on market activity.

The purchase and repurchase of “treasury” shares support shareholders through deferred taxation, i.e. at the time of realization of returns they are treated to long term for tax purposes at a rate substantially lower than ordinary income rates. The alternative, paying out surplus earnings in dividends, results in a higher taxation rate. The positive impact on earnings per share (EPS) should also be taken into account, as it shrinks the available shares to the public. These factors help to explain the recent growth of most equity indices, don’t they?

Given the above factors, one would expect that what central banks take off their balance sheets will flow back into the financial markets in one way or another.

Suggestions welcome.

Facebooktwitterlinkedinmail

INFLATION AND PRODUCTIVITY

EMR Mai 2024

Dear Reader

WHICH STATEMENT IS TRUE?

Inflation is currently assumed to be the most deterministic factor?

Demand management is the most important determining factor?

Suppls management is the most deterministic factor?

We believe that productivity is currently the most underestimated factor. The following charts speak volumes about this, don‘t they? From the two graphs of short- and long-term interest rates and inflation, in the USA since 1831, the following can be inferred:

  • Short-term interest rates tend to be high (as expeccted) during periods of high inlflation (above 4%):
  • Short-term interest raees also ten d to ge hith during period of negative inflaion (under -3%):
  • A quite astonishing, similar pattern can also be seen in the yields of 10-year government gonds.

Specifically, the chart of 10Y Government Bond yields suggest that over the long-term, interest rates appear to b driven more by the up and downs of the busines cycle than by inflation resp. deflation. Summarising we infer the following.

  1. Short-term interests rates:
    • Tend to be high – as it ought to be expected – in strong inflationary periods (over 4%);
    • Short-term interest rates tend to ge high also in periods of negative inflation (under -3%), while short-term intrest rates tend to Be lower than the long-term averages.
  2. Long-term interest rates:
    • Tend to be high – as it ought to be expected – in strong inflationary periods (when inflation surpassees 4%);
    • The raes of increase are significantly lower in period of deflation than in periods of high inflation!

CURRENT EXPECATIONS

The widespread focus on inflation as a deterministic corrective force is indeed somewhat questionable. The fact is that there are many reasons why prices change. In the current economic phase, we argue in particular that inflation is, to a significant extent, due to supply constraints, not demand as portrayed in the media, by central bankers and many experts. If, as is currently the case, supply, e.g. of crude oil, is motivated by political behavior, it cannot be assumed that demand factors are decisive for inflation.

At present, it can be argued that the measures taken by central banks to lower interest rates have not been – and are not – as promising as is repeatedly claimed. We wonder how producers and suppliers of crude oil, for example, could be persuaded to lower their respective selling prices as a result of the respective selling prices as a result of the reduction in local interest rates. We do not see this policy as a promising way to solve the current supply bottlenecks.

Both Russia‘s war against Ukraine and the worrying situation in the Middle East continue to be alarming constraints on supply, suggesting that prices will remain high and will be very difficult to reduce significantly. This environment is expected to have a significant impact on currencies.

As Swiss investors we continue to be overexposed to our own Swiss market, due primarily to currency expectations.

Suggestions are welcome.

Facebooktwitterlinkedinmail

WHERE ARE THE STOCK MARKETS HEADED?

EMR April 2024

Dear Reader

RECENT DEVELOPMENTS

Most forecasts can be characterized as rather pessimistic, as far as short- and medium-term expectations are concerned. Therefore, they can be considered somewhat unpromising and relatively incoherent. In this EMR we will focus on the average performance of several equity indices to try to define a likely outlook.

The following graphical representations of specific stock indices speak for themselves. In the first graph, we focus on the average annual change over the past four years in order to derive a promising result for the year 2024. The second graph uses the same data, and a traditional visualization.

Comparing the index increases shows that annual growth rates differ significantly from index to index. Does this suggest that the factors used to explain each index performances are not the same? In forecasting term this is the real question at this time, isn‘t it? Since the graph may pose particular interpretative difficulties, let us illustrate the same data in a more “traditional” way.

The charts show 2021 as the best performing year, while 2022 was the poorest performing one. From the traditional illustration it can clearly be inferred that the composition of the various indices speak for themselves throughout the period under review. The graphs, in line with known developments, indicate that the SARS-Covid 19 outbreak affected the European indices significantly more than the other indices. Recall that the first human case of Covid occurred in Wuhan, People’s Republic of China, in November 2019. The World Health Organization declared the outbreak of Covid-19 a health emergency of international significance on 30.01.2020 and a pandemic on 03.11.2020. Looking a little more closely at the recent, rather surprising past in order to assess the near future, we find the following determinant differences.

A first determinant, according to our personal assessment, relates to the technology content of each index. The reader might recall that in previous EMRs we have expressed our concerns about this, pointing out, for example, the outperformance of the NASDAQ index in the years 2020, 2021, and for the time being also in 2024. However, the current year’s performance is not really comparable due to the availability of short-term data. There is no doubt that 2022 was the worst performing year, according to the reported stock indexes, in conjunction with the Russian aggression on Ukraine. Since February 24, 2022, targeted disinformation and conspiracy narratives have accompanied the expansion of Russian aggression. Ongoing Russian aggression has and continues to have repercussions that are difficult to quantify, both economically and politically in general, with a devastating global impact in the short to medium term. We should not forget that Ukraine has been (and should remain) the breadbasket of Europe, while Russia is a major exporter of crude oil, especially in cooperation with suppliers in the Middle East.

ASSESSMENT

The following diagram suggest significant, differential impacts between one stock index and another. We believe that these differences are a clear indication that the performance of each index is not easily comparable, mainly because of the assessment of the impact of interest rate adjustments by Central Bank authorities. This is true for both the period since December 1998 and the period since December 30, 2008, and also for the most recent period from 2019 to the present.

The charts allow us to characterize the focus on interest rates as the main determinant of market developments – mainly or even exclusively on the actions and reactions of monetary authorities – as rather questionable, if not misleading.

While searching for current clues on the whereabouts of interest rates, we came across an amazing infographic titled “The ECB and Its Watchers 24” focusing on the whereabouts of interest rates. The summary highlights the end of the inflationary spurt, the transmission of monetary policy and the banking system, and the relative impact of geopolitics. At the conference, ECB President Christine Lagarde emphasized that the ECB cannot commit to further rate cuts after a likely first move in June. … The latest move by the Swiss National Bank (SNB), on the other hand, is indeed astonishing. On March 21, 2024, it became the first central bank to announce a turnaround in interest rates, citing lower inflationary pressure and a stronger franc in real terms! At its March 2024 meeting the FED, on its part, kept rates unchanged, acknowledging that the economy is “strong”. It is worth recalling, that the FED has kept interest rates steady since July 2023.

The tricky question at this point concerns the determinants of inflation and inflation expectations. Most commentators argue about the economic outlook and the possible reactions of central banks. From a Swiss perspective, the assessment could be very contradictory to the European and/or the US views.

Our assessment for Switzerland takes the Swiss franc into account as a key factor. The details relate to the outlook for import and export prices, both in the short and medium term. Rising crude oil prices, which as we know are quoted in USD, have a different impact on the “domestic” inflation rate via the appreciating CHF, than in countries with depreciating currency. The decisive factor for the CHF, in the current constellation, is not the actions of the SNB, but the international demand for CHF, which for many foreigners, is likely to represent a value of last resort.

The USA and the European Union continue to focus on economic growth as a promising indicator for the whereabouts of the stock markets. At this stage, we see an important difference between the US and European economic outlooks. The growth outlook in the US is, in some ways, much more promising. The main determinant of US economic activity is the increasing “re-shoring” of production, particularly in technology-oriented sectors. One indication of this is the slowdown in imports of technology goods from China. If our different assessments are accurate, the Fed‘s assessment will prove to be correct, while the ECB‘s may not be as accurate.

EXPECTATIONS

The outlook remains difficult to assess. Both the Russian aggression against Ukraine and the lack of a prompt response from the most important international players make any economic assessment difficult and hardly quantifiably with sufficient certainty. Next you find our contextual assessment.

The primary determinant relates to the “end” of the Russian war against Ukraine. No politician seems to be able, willing and/or determined to confront Mr. Putin; not China, not the US, not the United Nations … We consider this to be the most difficult deterministic assessment at this crossing. We fear that international trade will lose out, also as a consequence of other conflicts around the world.

In this “absurd” environment, technology can still be seen as the most promising sector of the global economy, which should continue to drive engine of equity markets. We believe that an investment approach focusing primarily on the local market remain indeed promising. Expectations regarding economic growth can still not be assessed with sufficient certainty. We assume that volatility will remain substantial. In such an environment, inflation and interest rate expectations remain difficult to assess with a relatively high degree of certainty. As a result, a relatively high degree of “domestic” concentration must be factored in for a certain period of time.

Suggestions welcome.

Facebooktwitterlinkedinmail

WHAT DO THE DATA SUGGEST?

EMR March 2024

Dear reader

GROWTH COMPARISON

The frequent repetition of comments – in the media – suggests that economic developments should be reasonably consistent from country to country. The charts, in this EMR, raise the question: What can be inferred from the performance of Swiss and US GDP for the respective equity indices and currencies, in the current uncertain and controversial environment? What follows is what we presume to know.

For simplicity and specific interest, let us compare the long-term trends of real GDP and respective primary components and pertinent currencies for Switzerland and the United States. The graphical representation of official data, released by ESA (Bundesamt für Statistik) and BEA Table 1.1.6 allow us to evaluate the respective trends of the “real” data with various projections and interpretation of the current economic trend.

ASSESSMENT

Which conclusions can be drawn from the above shown charts?

A first conclusion that jumps to mind relates to the different growth trends between an open economy (Switzerland) and a relatively closed economy (the USA)!

A second argument concerns the differential performance of the five components of Swiss and US Gross Domestic Product. To facilitate the comparison, between the individual components we have indexed the respective series to 1 for the first quarter of 1980. The graphs clearly show that economic growth in the USA is 1.73 times that of Switzerland! Moreover, the differences have grown over the entire observation period. Significantly, short-term volatility is higher in Switzerland than in the USA. A markedly higher degree of volatility can be found in the data on international trade and corporate fixed capital formation. Analyzing the development of the individual components in relation to GNP growth requires a very differentiated view, both at a consolidated level and for each individual sub-component. What is not visible in the charts are the respective currency trends: the USD tended to depreciate and the CHF to appreciate.

A third deterministic difference concerns the trend and growth rates of exports and imports of goods and services. The Swiss exports growth rate has exceeded that of imports almost throughout the entire period. It is also accompanied by persistent volatility. The growth rate of US imports has outpaced that of US exports by an increasing margin, especially in the last 10 years. The inverse trend is also known to drive the respective currencies. At this point, we might ask, what does this trend differential mean for the in-vogue interest rate management of the respective monetary authorities?

A fourth significant difference is the weakness and volatility of Swiss gross fixed capital formation compared to the weak but growing US fixed investment. These differences are pronounced, and the deterministic reason for their persistence remains to be seen. It is important to consider the role of innovation in the US versus Switzerland and its implications for fine-tuning interest rates in the fight against inflation. These developments present a real puzzle.

Another potential concern is the relatively weak and steady growth rate of consumer spending and the limited contribution of government spending over time.

REQUIREMENTS

The official data used in the charts determine to a certain extent the fluctuations in the share indices shown. If we take a closer look at the development of the individual indices, the following observations can be made:

There is no doubt that technological innovation and change has had and will continue to have a significant impact on the performance of equity indices, and not just these. As can be seen, the NASDAQ and S&P500 have been particularly responsive to technological innovation. It should be noted that the focus should not only be on price changes, but also on the independence of the domestic economy. As mentioned in previous EMRs, these interdependencies should be taken into account. Therefore, it is crucial to provide a clear answer to the following question: Why have most analysts and forecasters focused so much on inflation and not on technological innovation?

We wonder why many commentators, journalists and economists continue to focus primarily or even exclusively on monetary policy as the primary influence on markets.

Analyzing the demand for technological inputs in low-cost economies presents a unique challenge. In our view, not enough attention has been paid to this approach so far.

If we look at the long-term performance of the EUR/USD and CHF/USD exchange rates relative to the equity indices presented, we see that their performance is relatively poor compared to almost all of the equity indices presented.

This sustainable approach requires answering the following question: Why have most analysts and forecasters focused so much on inflation and not on technological innovation?

Let us stress that the global economy has proven to be more resilient than expected, with falling inflation and no sharp rise in unemployment. However, there is reportedly a shortage of skilled workers and experts in various sectors.

CONSIDERATIONS

Any forecast is based on assumptions that may directly or indirectly affect the investment strategy and potential returns in the face of unforeseen events.

Since 1992 and over the last four years, the monthly performance of the equity indices is as follows:

It is unclear why the central banks’ focus on fighting inflation by adjusting interest rates has such a significant differential impact on the performance of the DJIA (+10.4%) compared to the Nasdaq (31.2%) or the NIKKEI (1.7%).

Assuming that the planned interest rate cuts by the U.S., Eurozone and Swiss central banks would not have an equivalent and significant impact on private consumption and business fixed investment, what would be the impact on consumer spending and investment be if a war were to break out, especially if it continued to hamper the development of international trade?

CONCLUSIONS

We continue to believe that war in Ukraine and the Middle East might remain more decisive than monetary intervention. In addition, we are concerned about the potential impact on world trade, due to the irregular performance of China, Russia and other competitors in the free world.

In other words: We expect volatility to remain high, especially in the first quarters of 2024, which will need to be managed primarily by adjusting sector and stock selection. The primary source of concern at present is none other than technology. In some sense it is viewed as a limit for the correlation between feared deindustrialization vs. economic liberty. The example of China is promising indeed. The Chinese example points to the importance of private enterprise as compared to “statalist” policies. Experts state that the Chinese economic miracle is not so much due to public policy, but rather the result of “private” efforts, so-called “grassroots capitalism”.

Our biggest fear is that the expected/feared interest rate adjustments by central banks in the free world will continue to be unsatisfactory due to the unbridled control of international trade by China, Russia and their respective alliances. In this context, the decisive factor for the development of inflation will be the period in which the possible/feared difficulties in the transit of goods through the Suez Canal cannot be overcome by interest rate adjustments.

A specific factor that will accompany us during 2024 is the presidential elections in the United States. It is very difficult for us to assess the possible outcome.

While a large majority of analysts set theirs focus on fighting inflation, we prefer to focus on economic growth especially international trade as the determinant of our Investment Outlook.

Suggestions are welcome.

Facebooktwitterlinkedinmail

PAST = FUTURE?

EMR February 2024

Dear Reader

STOCK INDICES = EYE-OPENER?

Recent developments show on the financial markets that hope and fears are not and cannot be the only tools explaining their performance. Consequently, in this EMR we focus on the performance of selected equity indices. In addition, the environment continues to be characterized by absurd and unacceptable armed conflicts and other shocks that could shake the world.

The following chart raises the question: What can be deduced from the performance of the stock indices and currencies in the current uncertain and controversial environment? What follows is what we believe to know.

After increasing instability due to the COVID-19 pandemic, the markets collapse in February 2020. Overall, from January 3, 2023, the graph shows significant differences in growth, but rather congruent declines.

Significant differences in growth across countries are seen in the second period from 2021 and the interim peak on February 18, 2021 (1.58 indexed series or 16057.44 real closing prices of the Nasdaq index). It is worth recalling that 57.68% of the Nasdaq index is made up of technology and 17.59% of consumer discretionary stocks. In the S&P 500 Index, the main indicators are: 26.1% = Information Technology, 14.5% = Health Care and 12.9% = Financials. Consumer discretionary accounts for only 9.9% and industrials for 8.6%. The SX5P Index and the NIKKEI Index are the worst performers in our shortlist for the period from November 26, 2021 to early 2024.

DETERMINISTIC ASSUMPTIONS

The chart above prompts an inquiry into the primary factors influencing the fluctuations of the stock indices shown. Upon closer examination of the performance, the following observations can be made:

  1. Technological advancements have greatly influenced the performance of the analyzed indices. The NASDAQ and the S&P500 have particularly responded strongly to these innovations. It is important to note that the focus should not solely be on price changes, but also on the independence of the domestic economy. As mentioned in the previous EMR, these interdependencies should be taken into account. Therefore, it is crucial to provide a clear answer to the following question: Why is it that most analysts and forecasters have focused so much on inflation and not on technological innovation?
  2. We wonder why a large number of commentators, journalists, and economists continue to focus primarily, or even exclusively, on monetary policy as the primary influence on the markets.
  3. Analyzing the demand for technological inputs in economies with low-cost production presents a unique challenge. In our view, this approach is still not receiving enough attention.
  4. (d) When examining the long-term performance of the EUR/USD and CHF/USD exchange rates in comparison to the presented equity indices, it is apparent that their performance is relatively subdued in comparison to nearly all of the equity indices presented.

The global economy has proven to be more resilient than expected, with falling inflation and no sharp rise in unemployment. However, there is reportedly a shortage of skilled workers and experts in various sectors.

CONSIDERATIONS

Every forecast relies on assumptions, which can directly and indirectly affect the investment strategy and potential returns in the face of unforeseen events.

Since 1992 and over the past four years, the monthly performance of the stock indices is as follows:

  1. It is unclear why the central banks focus on fighting inflation through interest rate adjustments has such a significant impact on the performance of the DJIA (+10.4%) compared to the Nasdaq (31.2%) or NIKKEI (1.7%).
  2. Assuming that the planned interest rate cuts by the US, Eurozone and Swiss central banks would not have an equivalent and significant impact on private consumption and business fixed investment, what would be the impact on consumer spending and investment if there were to be a war trend, especially if this continued to hamper the development of international trade?

CONCLUSIONS

We continue to believe that war developments in Ukraine and the Middle East will remain more decisive than monetary interventions. We are concerned about the possible impact on world trade due to the uneven performance of China. Russia and other competitors in the free world.

In other words, we continue to anticipate high volatility in the first two quarters of 2024, which will have to be dealt with mainly by adjusting sector and stock selection beyond equities.

Our biggest fear is that the planned/feared interest rate adjustments by central banks in the free world will continue to be unsatisfactory due to the unbridled control of international trade by China, Russia and their respective alliances. In this context, it will be deterministic for the development of inflation over which period of time, the possible/highly feared difficulties concerning the freight transit in the Suez Canal cannot be managed via interest rate adjustments.

A specific factor that will accompany us in the course of 2024 are the Presidential Elections in the USA. We have a tremendous difficulty in assessing the possible outcome.

While the large majority of analysts set theirs focus on fighting inflation, we prefer to focus on economic growth especially international trade as the determinant of our Investment Outlook.

Suggestions welcome.

Facebooktwitterlinkedinmail

Outlook 2024

EMR January 2024

Dear Reader

GENERAL CONDITIONS

Last year saw Russia’s much-publicized military misdeeds in Ukraine and the war in the Middle East, as well as international power struggles in the technology sector. In addition, a new difficulty emerged, namely the “closure” of the Suez Canal. Shipping companies have faced longer delivery times and thus increased costs for Asia-Europe trade through the Cape of Good Hope at the southern tip of Africa. These developments raise fears of an expectation of impending rising costs. Depending on the duration of the closures, this would mean an additional inflationary element that could not be addressed by interest rate adjustments by central banks.

It is well known that central banks are currently expected to further raise interest rates, in order to “lower” the inflation rate. The exception may be the USA. Although the just published inflation rate for December (3.4%) is higher than anticipated, it is to be expected that interest rates will be reduced further in the 2024 presidential election year. Officially independent of the Administration, the FED has been often shown to be politically aware in its timing. It is generally assumed that rising inflation rates, in due course, will lead to higher interest rates. We recognize this “Truism”, however, we wonder whether, in the given constellation, the reverse argument, i.e. higher required interest rates, would lead to a lower inflation rate? As already expressed in previous EMRs, we doubt it.

Readers may be wondering why we are so skeptical, i.e. that in the current circumstances higher interest rates from central banks can hardly influence the inflation rate, i.e. reduce it? It is well known that there are many reasons why prices rise/fall, as there are multiple causes of inflation. Price adjustments are, as we know, not simply the result of an expansion/restriction of the money supply or, simply put, the result of too much/too little money for a limited quantity of goods. It is well known that inflation has many causes. Preisanpassungen sind, wie wir alle wissen, nicht einfach das Ergebnis der Ausweitung/Einschränkung der Geldmenge oder einfach gesagt, das Resultat von zu viel/zu wenig Geld für eine begrenzte Menge an Waren. Die Inflation hat, wie wir alle wissen, viele Ursachen.

The best-known causes of inflation are defined as either demand (demand pull) or supply (cost pressure). At present, most analysts and central bankers use the demand pull as the determining forecasting tool, while we assume a shortage of supply. Even a superficial analysis of the factors determining inflation must assume that the shortage of crude oil, for example, due to Russia’s senseless attack on Ukraine and the war in the Middle East, including the short-lived closure of the Suez Canal, have driven up the price of one of the most important commodities (crude oil) and, as it looks now, will continue to play a role as a determining factor of uncertainty for some time to come. The rhetorical question we would like to ask here is: can further interest rate hikes by central banks put a stop to the restrictive supply policy? It seems to us that this is hardly possible, as supply restrictions can hardly be influenced by interest rate changes. As an indication, we would like to point to the price development during the OPEC period.

ASSUMPTIONS

In the current environment, forecasts are characterized by various assumptions, which directly and/or indirectly affect investment policy. In this regard, it would be appropriate to contemplate the long-term behavior of equities and government bonds. Beginning with 10-year government bond yields, it can be assumed that the recent rise in interest rates is wearing off. However, the discrepancies should not be underestimated. It can be assumed that central banks will soon reduce short-term interest rates, which should result in lower government bonds in the short term. The latest levels (see chart) show divergent economic developments, for example between the United States (GT10) and the United Kingdom (GUKG10) compared to Japan (GJGB10) and Switzerland (GSWiSS10).

However, we think it is worth comparing the performance of various stock indexes e.g. since 1992 and, in this case, also the DJIA over the past four years, on a monthly average. The following can be deduced from the graph:

  1. The growth differential of the NASDAQ index against all others shown indexes is extremely high. It highlights sectoral developments, which should have been given serious consideration in asset allocation since 2010. One may wonder why so little attention has been paid to this determinate factor.
  2. Looking at the performance of the other listed indices, it is evident that there are large disparities here as well, for example between the Nikkei index and the SPI index. Overall, the difference in performance averages 10%.
  3. The question now arises: what will happen next? Our hypothesis follows in the next section.

CONSIDERATIONS

Every forecast is characterized by assumptions, especially in the current situation. The respective assumptions determine, directly and/or indirectly not merely the investment policy, but also the possibility of achieving successful returns in the presence of uncertainties.

Comparing the performance of the various stock indices since 1992, and/or the other listed indices, over the past four years, on a monthly basis, the following conclusions might be achieved:

  1. It remains inexplicable why the central banks’ focus on fighting inflation, by adjusting interest rates, accounts for such a marked difference between the performance of the DJIA (+10.4%) versus the Nasdaq (+31.2%) or the NIKKEI (+1.7%)?
  2. Assuming that the planned interest rate cuts by the central banks of the U.S., Eurozone and Switzerland are unlikely to have an equivalent and substantial impact on purchases and the number of transactions, what will be the respective impact on consumption and investment if war trends continue to have a significant impact on international trade?

CONCLUSIONS

We continue to believe that war developments in Ukraine and the Middle East will remain much more decisive than those mentioned above.

In other words, we continue to anticipate high volatility in the first two quarters of 2024, which will have to be dealt with mainly by adjusting sector and stock selection beyond equities.

May the coming year 2024 bring us all good health, success and prosperity!

Facebooktwitterlinkedinmail

Turn of the Year 2023 -2024

EMR December 2023

Dear Reader

REVIEW 2023

Examining the developments of the SPI (Swiss Performance Index) and the DJIA Index e.g., for the last four years, both on the end of month and on a monthly average basis, as implicitly shown in the following charts, is indeed highly revealing. What can be deduced from the following charts is here the following:

Although the graphs of the SPI and DJIA stock indexes do not show striking differences, indicating a rather stable environment, with the exception of the period between January and February 2020 and 2021, it should not be forgotten that in the years under review there have been divergences in their respective daily performances, although they have not been as significant as might be inferred from repeated comments by various experts. However, it should be noted that the differences in the monthly averages are rather small compared to the month-end averages.

Readers might object that an analysis based on only two stock indexes is insufficient. For this very reason, we report the annual % change in the respective monthly averages for a number of stock indices, as shown in the following graph, which shows drastic differences, does it not?

The annual variations, as shown in the graph above, are indeed remarkable, both in terms of size and from index to index. A first specific argument, inherently contained but not deducible from the graph, concerns the fluctuations in the respective currencies (not shown in the graph). A further argument concerns the “technology” content of each index. Recall that during the period analyzed, technology has played – and will continue to play – a decisive role, not only for stock markets, but especially by virtue of the differential in economic activity between countries. At this point it is worthwhile, at least as a mere example, to compare the fluctuations of the DJIA with those of the S&P500 and/or the Nasdaq.

CURRENT ENVIRONMENT

Contextual analysis reveals to us that there are no “additional and decisive factors” to take into account. The Russian war against Ukraine and the war in Gaza continue to remain deterministic. The expectations remain conditioned by geopolitical instability, while technological innovation and central bank measures aim to fuel certainty. As a consequence, we find the economic outlook to be far from rosy. Crude oil producers continue to play a rather dangerous role. Their goal is to keep energy prices as high and as long as possible, essentially to be able to finance absurd and devastating wars.

In addition to the fact that consumption is the engine of economic activity and thus has been and continues to be the promoter of prosperity, we also expect several stimuli from international trade in essential goods and services. It will be difficult to contain price increases. Consequently, the actions and responses of monetary authorities should not focus excessively on fighting inflation, but rather on stimulating domestic economic activity, which requires a shift from foreign investment to domestic renewal. It should be noted that the other components of GDP have apparently not contributed as significantly to economic activity, which is a surprising sign.

To explain what we mean, and for simplicity’s sake, we limit our analysis to the developments in the United States, assuming that the impact may be somewhat similar in other industrial countries. U.S. data since 1947 show that consumer spending remains the largest contributor to GDP. Nevertheless, the following table of U.S. GDP and its major components reveals rather surprising results. Over time, consumer spending has tended to be less pronounced, that is, less driving. The spread has widened over time. The growth differential is clearly visible in the data (see table), while all other GDP components seem to make only a marginal contribution. Whether this assessment is “right” or “wrong” as a measure of the respective levels, is the appropriate question at this stage. is it not?

In order to analyze the U.S. economic activity data shown in the following table, let us first define the headings: GDP = Gross Domestic Product; C = Consumption Expenditure; IFIX = Investment Expenditure; X = Exports; M = Imports; and G = Government Expenditure. The overall rates are summarized in the following table:

A close examination of the data in the table above speaks volumes. Although the data point to consumption spending as the driver, the growth rates of the other components of GDP suggest to us that imports are the key determinant of GDP growth, followed by exports and investment. Consumption spending ranks only fourth, while government spending precedes all other major GDP components. The table confirms our conclusion that the causes of the current disorder lie not so much in interest rate trends as in international social and moral disorder (Russia’s war in Ukraine)!

OUR EXPECTATIONS

The interpretation remains controversial and it is difficult to define a plausible and credible scenario. Volatility affects both the short and medium term. The monetary authorities and most forecasters are primarily concerned with restoring price stability, e.g., through higher interest rates. Against this backdrop, we continue to favor quality stocks, especially in the technology sector. The level of long-term interest rates is favorable for quality bonds, at least in the medium term, which promise attractive yields and opportunities for capital appreciation for the first time in a long time. Overall, we remain strongly focused on the domestic market for both equities and currencies. Never before in human history has a pandemic caused governments around the world to shut down their economies so abruptly and almost simultaneously, only to revive them with massive stimulus. The result remains uncertain, somehow pointing to the return of inflation, contraction in the labor market, rising bond yields expectations, and persisting high government indebtedness, continuing to nourish volatility.

MERRY CHRISTMAS & A HAPPY NEW YEAR

Comments are welcome.

Facebooktwitterlinkedinmail

Change is in the Air

EMR November 2023

Dear Reader

TOUGH OUTLOOK

It is well known that the IMF has issued a specific warning, namely that “financing the fight against climate change, only by means of incentives, seriously risks putting states” budgets in crisis. The IMF warning makes explicit reference to competition in the context of the energy transition campaign, and in particular to the U.S. Inflation Reduction Act (IRA), of August 16, 2022, which in hindsight has much more to do with fighting against inflation than with climate change.

This very important caveat leads us to examine the relationships between inflation, interest rates, and stock indices to be able to present a likely or possible outcome in terms of investment diversification. The following chart indicates significant differences.

Labeling: DJIA = Dow Jones Index; iS = 3 months interest rates; iL= 10y Govt Bond yields; Pdot = Consumer Prices; ls = left scale, rs = right scale.

OUR ASSESSMENT

The graph based on long-term series indicates a complicated period. We would like to highlight that the outlook continues to be driven by a high degree of uncertainty and therefore it is very complex and difficult to define precisely, especially in the short to medium term. Monetary authorities remain primarily concerned with restoring price stability, while in our view there should be a much greater focus on international trade and the corresponding impact on consumption and investment spending (private and public). Recent actions and reactions by governments do not seem to have been very appropriate, do they? Against the background of the change in sourcing of electronic products (chips and their manufacturing content), we are called upon to carefully analyze the “cost-benefit” ratio of the threat of protectionism, especially also because of Russian aggression in Ukraine and fratricidal wars in the Middle East and elsewhere. Moreover, we should evaluate this complicated scenario not only against the backdrop of China’s loss of productive power, but also against the backdrop of the expected and much-needed turn in favor of free market economies. Recent real GDP data in the U.S. (Q3 2023) clearly point in this direction. Important issues in this context are undoubtedly the “subsidy war” related to the Inflation Reduction Act (IRA) and the rather worrying rise of government debt to unsustainable levels, with perhaps one particular exception, that of Switzerland. Compared to the EU countries and the United States, the relationship in Switzerland is rather limited.

In this context, we ask ourselves what this reversal towards “domestic production” might imly for international investment diversification. Any suggestions?

Dramatic changes in the production process are in the air. We expect an increasing focus on domestic content, especially in the technological environment. However, this trend-reversal is not expected to evolve at high speed. This will be a determining factor in the long run. A second aspect we see will be the found in the evolution of labor markets, a change in trend from production offshoring to relocation to the local markets. Although this change may not be felt in the short term, it will have an impact on employment, especially in the field of technology. There is no doubt in our mind that international trade can modify the expectations of economic growth of those countries that are willing and able to finance new investment factories. Moreover, free trade will have to, increasingly, take into account the fact that it will move from being a promoter of the economy into second position, after local production. The well-known and much-vaunted virtues of global free trade in capital and goods as engines of economic growth will have to be consistently changed and adapted.

DETERMINISTIC RELOCATION

In the context of the expected shift in production, we focus on the following three factors, which we consider to be highly deterministic means of profitable investment allocation:

1. The relocation of production from abroad to the home markets or shores.

2. The deterministic importance of the availability of domestic inputs relative to imported inputs; and

3. The availability of domestic developped and produced technologies.

Recently, we have witnessed a deterministic revision of the importance of domestic versus imported production. Costs and benefits are more and more evaluated from the perspective of increasing protectionist interventions. In the international competition of free markets, the advantages and disadvantages are increasingly evaluated dynamically rather than predominantly statically. These shifts are increasingly seen as a reassessment of the concept “cheap” is no longer as deterministic as “on-time availability.”

A second aspect relates to the “content” of the means of production. The “low-cost production countries” began to raise prices and/or introduce specific costs. Production in China was defined as profitable compared to local production. In the context of the IRA mentioned above, the U.S. determined that production quotas were essential because computers could not function as expected without certain components that were only available in the U.S. The IRA was a major step in this direction.

The third aspect, which may be the most determinative, relates to the availability of domestically developed and produced technologies, i.e. an increased focus on domestic production. In terms of economic activity, we expect a significant impact on consumption and investment spending as we face, in a sense, a resurgence of protectionism. This trend is clearly visible with regard to the production of electric vehicles, but not exclusively so.

IMPACTS ON INVESTMENT POLICY

Currently, investors expect further, moderate, interest rate hikes as well as further exchange rate adjustments. As Swiss investors with a relatively high home bias, we continue to expect the CHF to outperform the EUR, USD and GBP as well as the YEN.

Economic activity is likely to remain subdued despite recent interest rate hikes, mainly driven by consumer spending. In addition, we are concerned about the weakness of the European economy, mainly due to German weakness, and the ongoing difficulties in China.

Nevertheless, stagflation is currently assumed. The global economy is suffering from a weak economic outlook and inflation that is difficult to control, especially through further interest rate hikes. Moreover, a growing number of analysts are asking: How can inflation be reduced, primarily by further interest rate hikes? Our answer, as expressed in previous EMRs, requires a rapid reduction in certain imports – especially crude oil and gas and an increase in domestic production of essential goods. The arguments outlined are our main reasons for focusing on investments in our local market, especially into account the expected and feared currency changes and also the technological developments triggered by an increasing focus on domestic activities.

Although the impact of political changes should mainly affect the medium to long-term outlook, we believe it will be imperative to closely monitor any feared economic recession. At this point in time, our outlook is also determined by the outcome of the war between Russia and Ukraine.

Behind the recent political, economic and social developments, which speak of a destructive competition, there seems to be an increasingly negative future, the so-called “chip war” (between the United States, China (including Taiwan and other manufacturers not only from Asia, but also from Europe). A further example is the electric car market. The graph on interest rate differentials points to an imminent reversal, doesn’t it?

Comments are welcome.

Facebooktwitterlinkedinmail

It doesn’t have to be that way

EMR October 2023

Dear Reader

CURRENT SETTING

Assessing the main determinants of economic developments has become extremely difficult, both in terms of duration and cyclical importance. As repeatedly pointed out in previous EMRs, we would like to state once again that the available long-term data, e.g., those on U.S. GDP, really seem to support our view that the outlook is not primarily as expressed by main stream analysts.

In order to explain what we mean; we kindly ask the reader to examine the following chart and accompanying table of US real Gross Domestic Product for the period 1947 to 2023. What we discover is puzzling indeed and at the same time highly revealing.

The chart on the levels of the major components of real GDP show the following:

1. Real consumer spending has been sitting, all along, in the driver`s seat, although its contribution to overall growth activity points to a slightly less pronounced growth performance, as compared to overall GDP. Contextually shouldn`t we speak of some weakness?

2. All other components seem to haven`t contributed much to overall economic activity; representing an astonishing development!

From the chart it can be deduced that the largest contribution to long-term GDP growth resides with consumer spending. Nevertheless, the chart points to an overtime less important average contribution. Overtime Consumer spending has tended to be less pronounced, that is, less propulsive. The divarication grew over-time. The growth differential is evident in the graph, while all other components of GDP seem to make only marginal contributions. Whether this assessment is “right” or “wrong” as a measure of the respective levels is at this time the appropriate question, is it not?

At this crossing we ask ourselves what this analysis implies both for the short as well as the longer-term outlook. Is the “level-comparison” the appropriate measure or are there other ways to assess the outlook?

For simplicity let us define the various variables in the Chart and Table: GDP stands for Gross Domestic Product. C for Consumer Spending, I for Investments, X for Export, M for Imports, and G for government Spending.

In US real GDP Table 12

Examining the chart and the table on US GDP & Components over the period since 1947, we wonder which component of U.S. GDP has really contributed most to overall growth? What can be inferred – both from the chart and the table – regarding the specific longer-term as well as shorter-term developments, in connection with the implemented policies on a worldwide scale?

Which component of GDP ought to get specific attention regarding the near-term outlook, most specifically in conjunction with monetary finetuning. A prima vista, on a level basis, as shown above, consumer spending speaks a clear language, doesn´t it? Nevertheless, we ask ourselves: Is this a correct way to analyze the most probable outcome, or are there other more important factors that ought to be taken into serious consideration? Yes we do, there are other telling variables. Interpreting the official data on US GDP and its main components requires a special focus of the developments of the international data set and particularly of imports and significanltly less so towards conumer spending. The calculated growth developments show, for the period since 1947 to an overall growth ratte of 6138 percent; 752.2 percent since 1980, 102.2 percent since 2000, and 14.3 percent since 2020.

The highest growth rates are to be found in imports and exports, followed by consumer spending! Nevertheless the policy approach remains intrinsically focused on further interest rate increases to reduce demand pressures, and with it inflation. Funny assumption is`t it? Foreign trade stands signficantly more for supply growth determinants of future policy developments and targets. We wonder why the focus continues to be set on local demand?

We persist in disagreeing with the widespread public assessment, that inflation can be managed via demand constraints. Recent developments clearly speak of rising electricity costs, rising transportation costs, rising gas prices, rising health care and insurance costs, and also a rising need to re-patriate some production lines (primarily in the technological field), etc., all determinants that focus mostly on domestic policies while inflation continues to remain primarily supply side determined.

EXPECTATIONS

In this intricate period, our scenario remains mainly determined by uncer-tainty and is therefore difficult to be implemented especially in the short to medium term. Monetary authorities are mainly concerned with restoring price stability.

INVESTMENT POLICY

At this time, investors expect further interest rate hikes as well as further exchange rate adjustments. As Swiss investors, with a relatively high home bias, we continue to expect the CHF to outperform the EUR and USD. In addition, we are concerned about the weakness of the European economy, which is largely due to German weakness, and the ongoing difficulties in China.

Nevertheless, the current assumption, concerns stagflation. The global economy is suffering from a weak economic outlook and inflation that is difficult to control, especially by means of rising and rising interest rates. A growing number of analysts are asking themselves how inflation can be re-duced primarily on the basis of further interest rate increases? Our answer, as also expressed in previous EMRs, requires a rapid reduction in specific imports – especially oil and gas – and an increase in domestic production of vital goods. The expressed arguments are our main reasons to set the main focus on investment in our local market, especially taking into account ex-pected-feared currency changes and, also, the technological developments that will be triggered by an increasing focus on domestic activities.

Although the impact of policy changes might affect mainly the medium- to long-term perspectives, we believe that it will mandatory to monitor a feared economic recession. At this stage, our outlook continues to be de-termined also by the outcome of Russia’s war with Ukraine.

Comments are welcome.

Facebooktwitterlinkedinmail