fbpx

Inflation

EMR September 2021

Causes, Effects and History

A look at the following chart of the Dow Jones Industrial Average (DJIA) and the Consumer Price Index (CPI, referred to here as Pdot) raises some questions, doesn’t it?

The chart says that volatility is significantly higher for the DJIA than for INFLATION. Are there reasons for the disparities?

Why the focus on inflation?

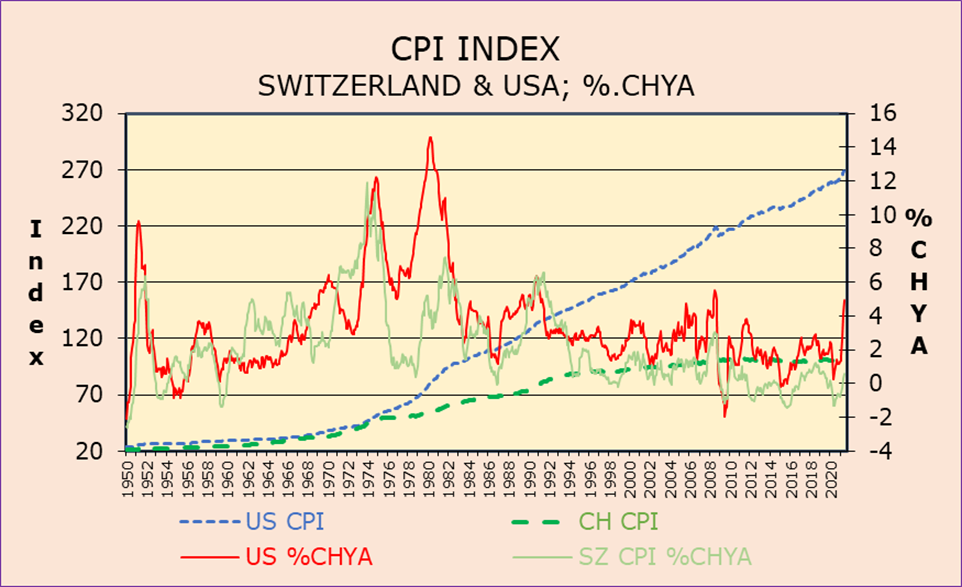
The latest data point to a pickup in inflation. For example, inflation as measured by the Swiss national consumer price index stood at 0.7% in July 2021, while it rose by an average of 2% in the Euro Area and by 5.4% in the U.S.A., representing at this time the highest level in 13 years. In this EMR issue, we are interested in the causes of the feared/expected rise in the inflation rate. In the past, developments comparable to those of the current economic policy developments were known as “the power to tax is the power to destroy.” Surely, a valid reason to inquire into the whereabouts of inflation.

Known causes of inflation

History tells us that there are several reasons why prices rise and fall, thus implying that there are many causes of inflation. At present ii is widely assumed that prices are rising as a result of a strongly expanding money supply. In other words, it is stated that there is too much money chasing too few goods and services. In the economic literature, this approach is referred to as “Demand pull inflation”.

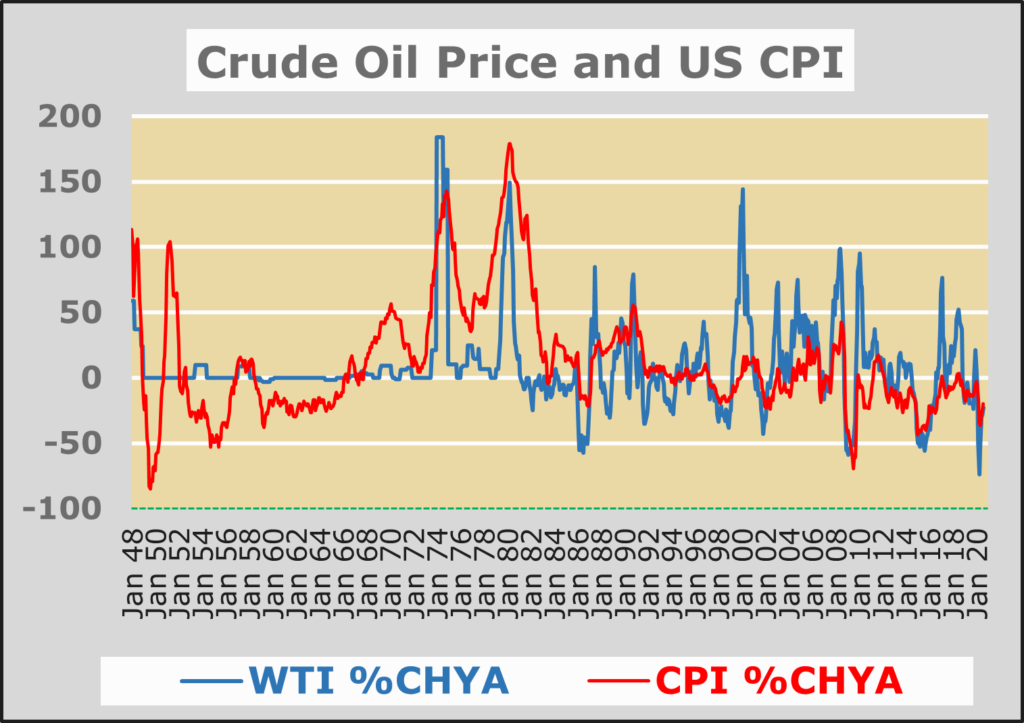
Demand pull inflation occurs also when supply falls while demand remains constant. A well-known example is the rise in OPEC prices in the late 1960s, early 1970s. The historic development on Crude oil price and CPI inflation are portrayed in the following chart.

The graph points to a much higher VOLATILITY in the crude oil price than in the consumer price index. The disparate developments hardly make forecasting any easier, do they?

If labor costs are arbitrarily increased, the affected producer will have to pay the price and/or suffer profit losses or even go out of business. This is certainly the case if the entrepreneur cannot improve productivity or reduce other costs. These are developments known as “Cost push inflation”.

When the government of a country – which issues its own currency – spends more than it takes in, prices will tend to rise. This approach is known as monetary debasement, which most governments have resorted to as a result of the Covid 19 pandemic. In earlier times this political refuge was also known as printing press inflation.

In recent weeks, governments have begun to focus on avoiding tax increases by taxing certain companies (see: Global minimum tax deal in our August 2021 EMR) and telling the public that their government will not raise taxes because they argue that certain companies will bear the cost. Not only economists, but also more and more people know that companies will treat taxes like other costs. If the costs cannot be passed on to consumers or other businesses, corporate profits and thus overall productivity will fall and/or there will even be wage cuts or even job losses. There is also a risk that certain companies will give up because they have difficulty raising capital. This means nothing else than Taxation decreases disposable income.

The chart of the US long-term inflation trends is telling indeed. Volatility has been highest from 1913 to the early 1950’s. The index rose dramatically, without great corrections since end 1960’s. Contextually, the question to be answered is: why the differences? Any suggestion concerning the near future? Does the chart say something about productivity?

The chart portrays the significant disparity of the trend of the CPI Index vs. its monthly rate of change. Striking indeed!

Before assessing the current situation let us examine the developments of interest rates. In the following chart we find a significant correlation between the 3-months rate and the 10-year bond yields.

The chart speaks for itself. It does not look very telling for the near-to-mid-term outlook, doesn’t it?

“Assessment through the looking glass”

Although the focus in this EMR is on inflation, we would argue that the outlook for productivity is the most crucial determinant for overall economic activity, interest rates, inflation and foreign trade. We argue that expanding and contracting credit demand has a much larger impact on short- and long-term interest rates than anything else.

We will therefore try to present a possible outcome in order to be able to define a promising investment strategy. The focus of our consideration is on the “power to tax”, which could end up as the “power to destroy”. In a capitalist environment, companies should not be excessively taxed to discourage the employment level of highly productive units that end up paying the price for policy missteps.

Pervasive socio-economic change

There is no doubt that we are faced with a new set of arguments primarily due to pervasive socio-economic change, a tendency to socialism and the implications of Covid-19. Economies in the developed world are driven in the short term by the multiple responses to the Covid-19 pandemic, while in the medium-to-long term they remain a function of technological advantage. It must be reckoned that the commonly used definition of productivity is output per man hour. Currently it is progressively determined by energy productivity and even more so by capital productivity.

The widespread, politically motivated assumption is that certain business owners should absorb these higher labor costs by cutting profits. However, since management and investors are usually not enthusiastic about this alternative, they will either try to raise prices to compensate for the increased costs or reduce employment, which will contribute to lower income growth. Neither option seems to make much sense at a time of “competitive disruption”, i.e. declining imports from low-wage countries. Nor does switching to cheaper substitutes seem to be a viable alternative. This seems to indicate that the fear of cost-driving inflation exists but is not as sustainable as generally expected. The switch to cheaper substitutes does not seem a feasible alternative either. What this seems to suggest is that fears of cost-push inflation exists but somehow not as sustained as widely feared or even expected.

In addition, based on the considerations outlined above, we believe that the decisive factor is and will remain the return to local production relationships! The struggle between the USA, Europe and China is obvious. Dependence on a producer with a ‘slightly’ different attitude than we are used to do business can no longer be accepted. Currently the outlook is also driven by the impact of Covid-19. It is a fact that labor productivity in the USA increased rapidly during the pandemic compared with the previous decade. However, it is unlikely that this rapid pace will continue. Similar to the Great Recession, the main reasons for the strong productivity growth now are cyclical effects that are likely to dissipate as the economy continues to recover. For example, as the number of workers has fallen, capital per worker has increased, raising “labor productivity” , i.e. including energy productivity and capital productivity. How the pandemic itself will impact productivity remains to be seen.

Our approach to economic growth makes it clear that the extraordinary recent rise in productivity is primarily due to cyclical effects that are unlikely to last and could even reverse. While there is much speculation about how the pandemic itself will affect productivity, it is too early to reliably assess how strong these effects will be in the long run.

The growth accounting shows that the main causes of the recent increase in productivity are cyclical and unlikely to last. In particular, the decline in employment has boosted capital deepening; the post-Great Recession experience suggests that this temporary boost is likely to reverse. Moreover, because the employment decline was more pronounced among workers with less education and experience, the average job quality of those who kept their jobs rose. This effect has already begun to reverse and may reverse further as less skilled workers return to work.

Conclusions for investors

The chart of the selected exchange rates on a monthly rate since 1971 does not yet points to an imminent change. Does the spending spree of the new US Administration tell us something, that we don`t know yet?

Our conclusions, are to be seen as a specific consequence of an extraordinary shift towards technological innovation away from traditional “output per man-hour”.

It also implies that even if inflation would narrowly fluctuate around 2%, historically seen, equities would continue to outperform fixed income securities and money market instruments.

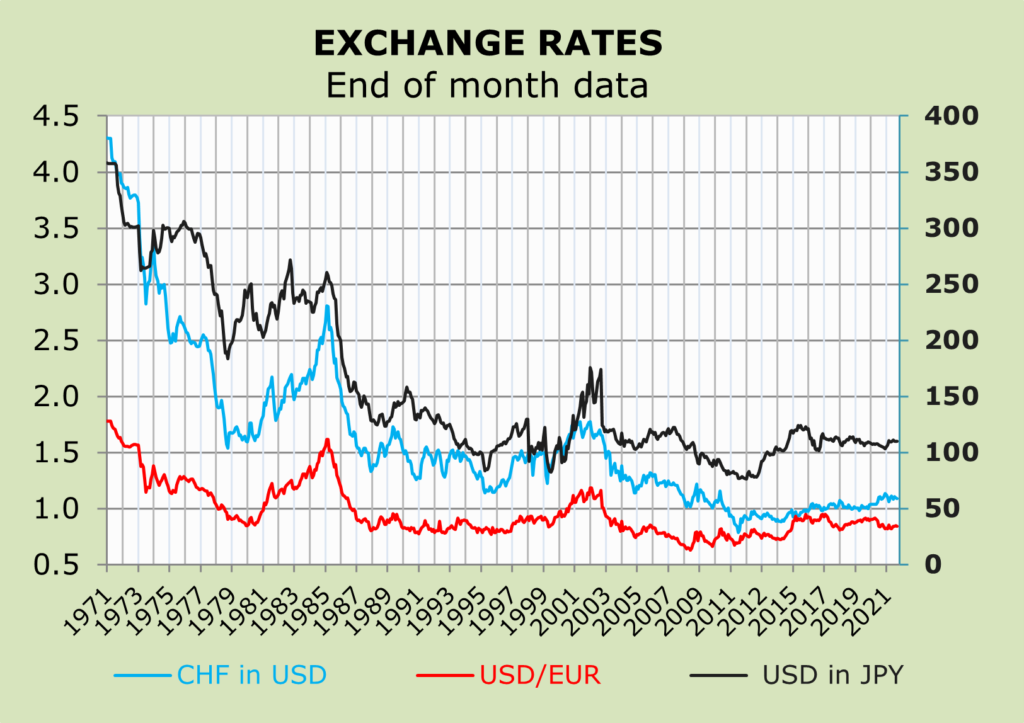
Consequently, the USD is expected to rise vs. EUR, YEN, and GBP.

Keeping in mind that versus the USD, the CHF, the EUR and the JPY have fluctuated withing rather narrow bands, at this juncture we see no impending dangerous clouds in the currency sky.

Any suggestion is highly welcome.

Facebooktwitterlinkedinmail

Global minimum tax deal

EMR August 2021

The introduction of a global minimum tax for companies is being hotly debated in OECD circles. Therefore we ask ourselves the following questions in this EMR: Which influences will it have on production, consumption and international trade? Will inflation be driven by this tax? What does a cyclical comparison say about this? What effects can be expected for large and small countries? Which asset classes are promising?

Assessment

From the historic point of view, it is not surprising to understand why most commentators view as obvious immediate effects of tariffs or quotas to determine the tendency of prices to equilibrate among trading partners. With trade barriers, relative goods prices are no longer expected to be equal in the various countries. The aim of this EMR is to quantify as much as possible the impact of the global minimum tax of at least 15% now being publicly discussed. As we understand it, the proposals are to make the world`s biggest companies pay taxes in countries where they have significant sales but no physical headquarters. So far, we have not come across quantified expectations on the repercussions on equity prices.

Impacts on demand and supply

The real question is what are the repercussions of the agreement of a large number of nations to support the U.S. proposal (of Treasury Secretary Janet Yellen) to a global minimum tax of corporations? No doubt such an agreement represents a turnaround in the international tax competition. Expectations are that such a tax ought to determine or alter the relative price of the impacted goods. Respective impacts are expected regarding production, consumption and international trade. Theoretically it is rather easy to point to the respective impacts on the demand and supply curves, while empirically it remains a tricky attempt. Assuming that theoretically the amount of the “specific” good exported or imported at a given price (before the leaving of the new tax) is determined by the difference between demand and supply, what will be the impact of the 15% minimum tax deal? The available information depends on a working assumption that the demand curve either lies to the right of the supply curve (pointing to excess demand), at a given price, implying the availability of exports. On the other side if the demand curve lies to the left of the supply curve, at a given price, more of the taxed good is produced domestically than consumed, pointing to the availability of exports.

One of the major difficulties regarding the impact of the global minimum tax deal refers to disparities of the differential data basis on which the percent tax is levied. What effect will the tax have on the various countries? The immediate effect of the global deal tax is to create separate prices from country to country. The impacts are on the one hand differentiated expectations concerning the rate of inflation and on the other hand alter the trade relations. The exact change in the relative price and the level of trade depends on the slopes of the supply and demand curves, defining the marginal rates of transformation in production in the respective countries. The slope of the supply curve corresponds to the change in price necessary to induce a change in the quantity supplied. Similarly, the slope of the demand curve corresponds to the community indifference curves. These my summary comments are sufficient to explain the dichotomous interpretations available regarding the potential effects on inflation, economic activity and exchange rates. An environment speaking of sizeable volatility on the financial markets.

What are the costs of the mimnimu tax for a small country?

No doubt the proposed tax increase will change the relative price of the good on which the tax is levied. The outcome will preponderantly concern the relative price of production as well as the domestic relative price in consumption. Given that a small country has only a very limited power to affect the terms of trade the tax is expected to create a wedge between the domestic relative price in production and consumption. The result ought to be a reduction of production as well as consumption. Taxing exports raises the price of the county buying the respective good causing the relative price to be altered. A possibility that the country imposing the tax calls for an increment of the wedge for the receiving country. The wedge favors the exporting country to the detriment of the importing country. The impact of a tax is highly difficult to quantify when income, tastes and technology changes frequently, as is currently the case. A surge or decline in domestic demand must be relieved through domestic price and quantity adjustments. Domestic price fluctuations therefore must not always coincide with world price fluctuations.

Inflation differences*

The below shown charts on the monthly CPI inflation for the USA and Switzerland for the period since 1950, and the respective percent changes on a yearly basis, point to known disparities. The trend graph for Switzerland points to similar interpretative difficulties. We assume that these differences from country to country are unlikely to be significantly changed by the announced global minimum tax. This primarily due to production and consumer differences and implicit inefficiencies. It seems highly advisable to us to examine the inflation charts in greater detail. The disparities have always been sizeable not only between the USA and Switzerland but also regarding many other nations.

Examining past events, we find sizeable differences of recent developments as compared, e.g. to the late 1970´s – early 1980`s and for the years 2008 – 2009. Of forecasting importance is that the trend growth of the indexes do not point to the changes in the monthly data! In addition there are sizeable cyclical differences. 1970 and 1975 have been scary indeed. Given the above-mentioned uncertainties regarding the expected reactions of producers and consumers to the global minimum tax deal, we come to the conclusion that the outlook is somehow uncertain but not catastrophic as widely assumed.

Conclusions for investors

Our conclusions, are to be seen as a specific consequence both of a production and consumption distortion. An international trade intervention, like the global minimum tax deal, is meant to solve both distortions. The main aim is to reduce the dependence form imports from low-cost producers, mainly from China. What we know is that it will take more time than assumed by the responsible politicians, and this due to the fact that increasing domestic production will take time. Today´s setting is significantly more complex than e.g. it has been in the case of steel imports in 1977. In addition, we assume that the global minimum tax deal may not be the best way to eliminate the inequalities, given that the tax deal may reduce world welfare by reducing the level of satisfaction of foreign countries more than the satisfaction gain to the domestic country.

In terms of the investment strategy, we believe that the “political induced approach” simply calls for a prolongation of the period of uncertainty and volatility. Why, you may ask? Well, the proposed policy does not address the DISTORTIONS mentioned above. The primary purpose of levying taxes is to finance government deficits, without significantly improving output and productivity and/or to increase consumption and employment in a timely manner. Consequently, we continue to see potential in the stock markets compared to fixed income and money market investments. Currency hedging will have to be considered in the international portfolio diversification approach.

Any suggestion is highly welcome.


* Environmental influences such as heat waves, depletion of water resources and fires, or floods and storms are not taken into account.

Facebooktwitterlinkedinmail