EMR October 2023
Dear Reader
CURRENT SETTING
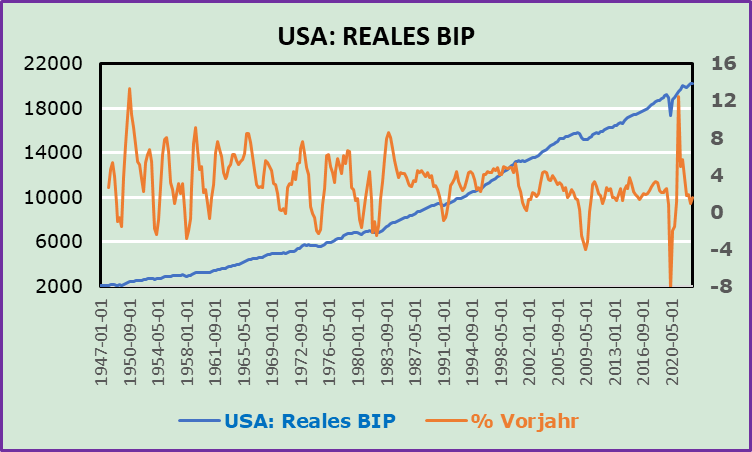
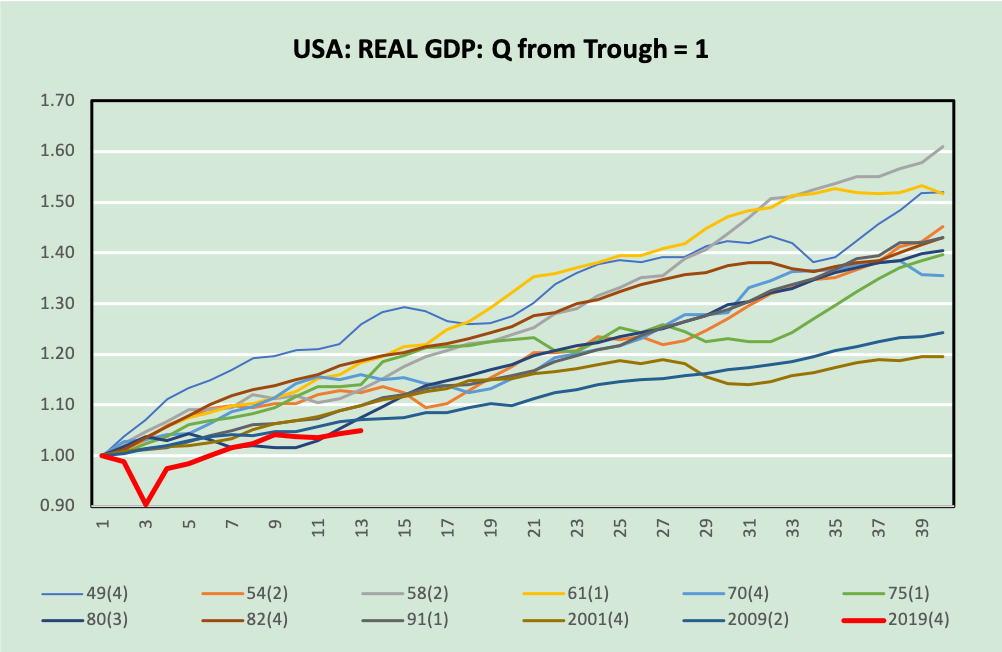
Assessing the main determinants of economic developments has become extremely difficult, both in terms of duration and cyclical importance. As repeatedly pointed out in previous EMRs, we would like to state once again that the available long-term data, e.g., those on U.S. GDP, really seem to support our view that the outlook is not primarily as expressed by main stream analysts.
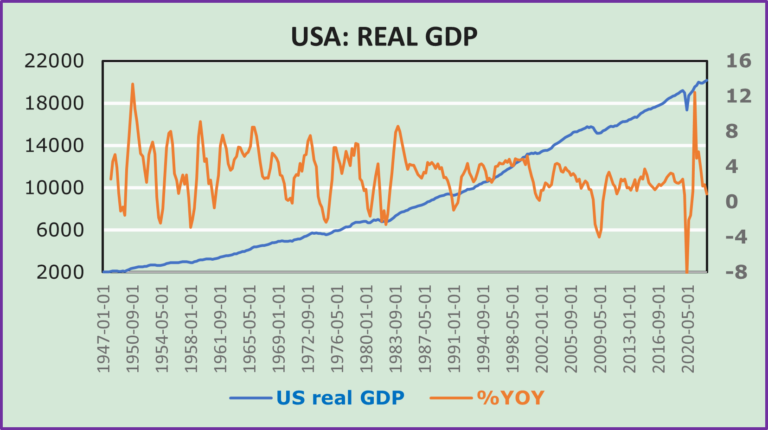
In order to explain what we mean; we kindly ask the reader to examine the following chart and accompanying table of US real Gross Domestic Product for the period 1947 to 2023. What we discover is puzzling indeed and at the same time highly revealing.
The chart on the levels of the major components of real GDP show the following:
1. Real consumer spending has been sitting, all along, in the driver`s seat, although its contribution to overall growth activity points to a slightly less pronounced growth performance, as compared to overall GDP. Contextually shouldn`t we speak of some weakness?
2. All other components seem to haven`t contributed much to overall economic activity; representing an astonishing development!
From the chart it can be deduced that the largest contribution to long-term GDP growth resides with consumer spending. Nevertheless, the chart points to an overtime less important average contribution. Overtime Consumer spending has tended to be less pronounced, that is, less propulsive. The divarication grew over-time. The growth differential is evident in the graph, while all other components of GDP seem to make only marginal contributions. Whether this assessment is “right” or “wrong” as a measure of the respective levels is at this time the appropriate question, is it not?
At this crossing we ask ourselves what this analysis implies both for the short as well as the longer-term outlook. Is the “level-comparison” the appropriate measure or are there other ways to assess the outlook?
For simplicity let us define the various variables in the Chart and Table: GDP stands for Gross Domestic Product. C for Consumer Spending, I for Investments, X for Export, M for Imports, and G for government Spending.

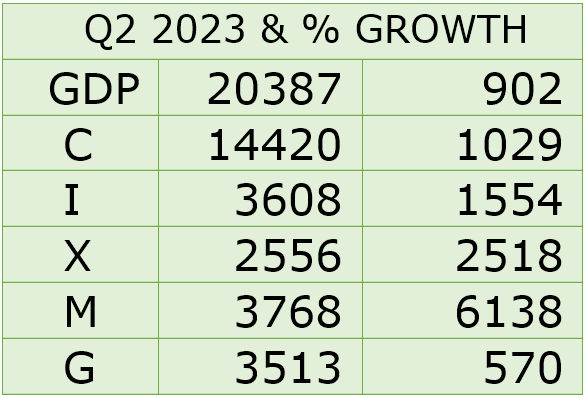
In US real GDP Table 12
Examining the chart and the table on US GDP & Components over the period since 1947, we wonder which component of U.S. GDP has really contributed most to overall growth? What can be inferred – both from the chart and the table – regarding the specific longer-term as well as shorter-term developments, in connection with the implemented policies on a worldwide scale?
Which component of GDP ought to get specific attention regarding the near-term outlook, most specifically in conjunction with monetary finetuning. A prima vista, on a level basis, as shown above, consumer spending speaks a clear language, doesn´t it? Nevertheless, we ask ourselves: Is this a correct way to analyze the most probable outcome, or are there other more important factors that ought to be taken into serious consideration? Yes we do, there are other telling variables. Interpreting the official data on US GDP and its main components requires a special focus of the developments of the international data set and particularly of imports and significanltly less so towards conumer spending. The calculated growth developments show, for the period since 1947 to an overall growth ratte of 6138 percent; 752.2 percent since 1980, 102.2 percent since 2000, and 14.3 percent since 2020.
The highest growth rates are to be found in imports and exports, followed by consumer spending! Nevertheless the policy approach remains intrinsically focused on further interest rate increases to reduce demand pressures, and with it inflation. Funny assumption is`t it? Foreign trade stands signficantly more for supply growth determinants of future policy developments and targets. We wonder why the focus continues to be set on local demand?
We persist in disagreeing with the widespread public assessment, that inflation can be managed via demand constraints. Recent developments clearly speak of rising electricity costs, rising transportation costs, rising gas prices, rising health care and insurance costs, and also a rising need to re-patriate some production lines (primarily in the technological field), etc., all determinants that focus mostly on domestic policies while inflation continues to remain primarily supply side determined.
EXPECTATIONS
In this intricate period, our scenario remains mainly determined by uncer-tainty and is therefore difficult to be implemented especially in the short to medium term. Monetary authorities are mainly concerned with restoring price stability.
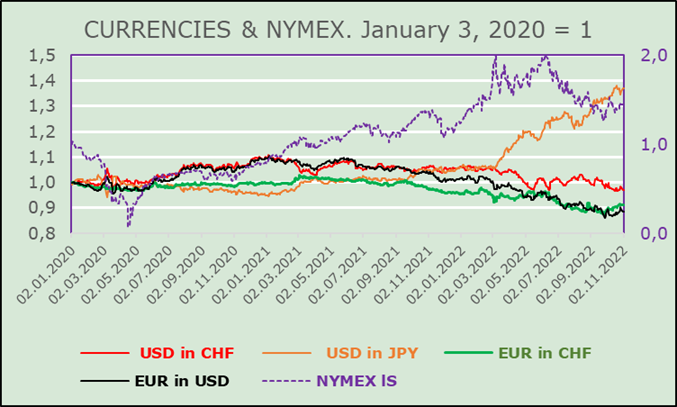
INVESTMENT POLICY
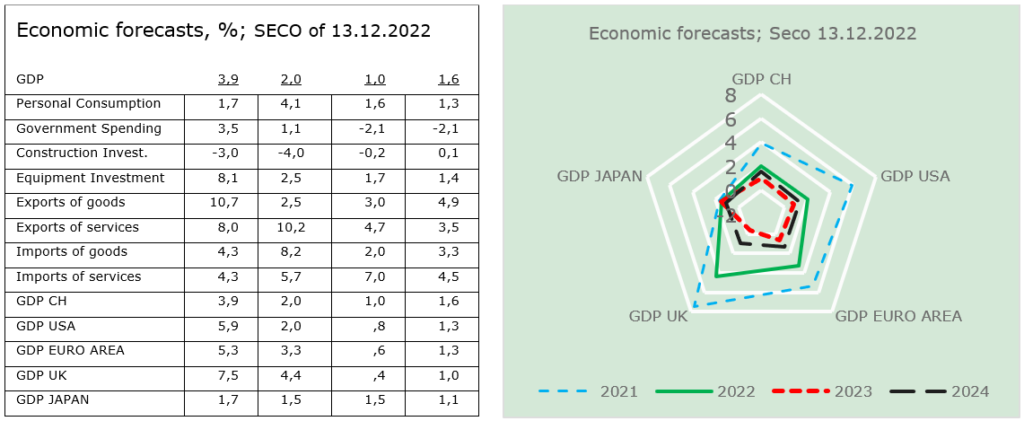
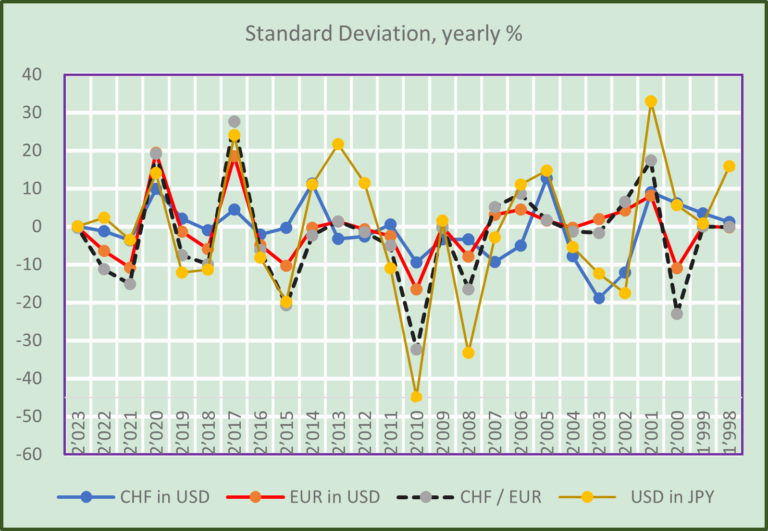
At this time, investors expect further interest rate hikes as well as further exchange rate adjustments. As Swiss investors, with a relatively high home bias, we continue to expect the CHF to outperform the EUR and USD. In addition, we are concerned about the weakness of the European economy, which is largely due to German weakness, and the ongoing difficulties in China.
Nevertheless, the current assumption, concerns stagflation. The global economy is suffering from a weak economic outlook and inflation that is difficult to control, especially by means of rising and rising interest rates. A growing number of analysts are asking themselves how inflation can be re-duced primarily on the basis of further interest rate increases? Our answer, as also expressed in previous EMRs, requires a rapid reduction in specific imports – especially oil and gas – and an increase in domestic production of vital goods. The expressed arguments are our main reasons to set the main focus on investment in our local market, especially taking into account ex-pected-feared currency changes and, also, the technological developments that will be triggered by an increasing focus on domestic activities.
Although the impact of policy changes might affect mainly the medium- to long-term perspectives, we believe that it will mandatory to monitor a feared economic recession. At this stage, our outlook continues to be de-termined also by the outcome of Russia’s war with Ukraine.
Comments are welcome.