EMR May 2023
Dear Reader
One of the most frequently asked questions we are getting concerns the status of the current financial turmoil, compared to previous corrections as regarding stock indices. In our opinion both the following graph and table comparisons are very telling.
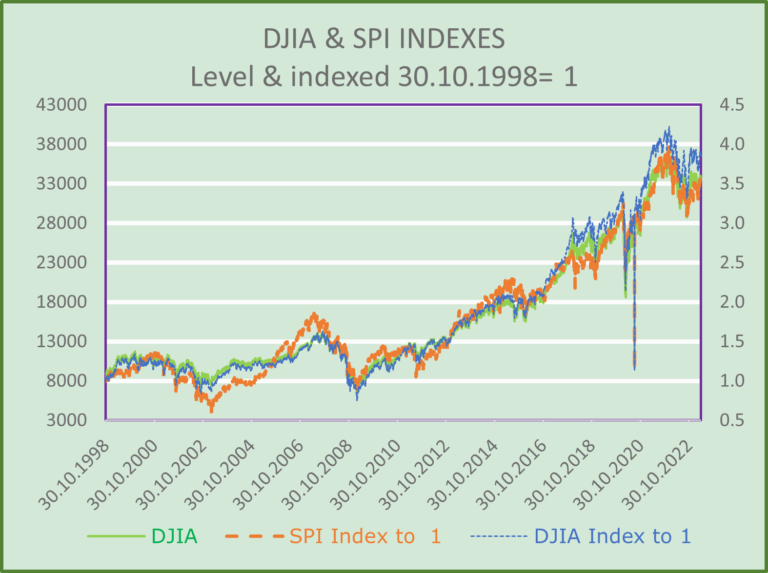
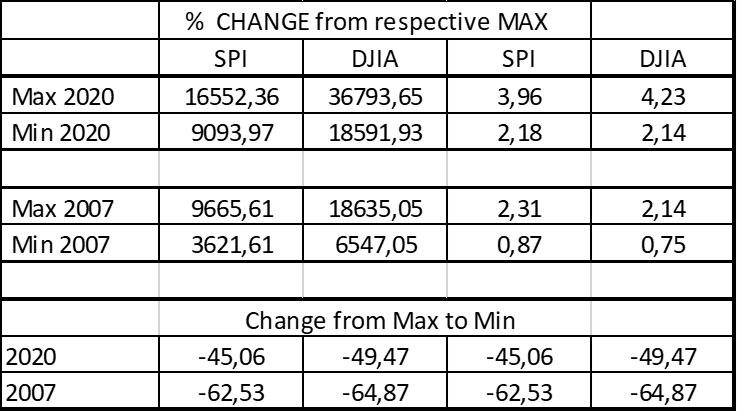
From the graph and the table we can deduce that the current crisis is the worst since the Black Friday of October 25, 1929. Equally, it is worse than the 2008-2009 financial crisis. Under these circumstances, we should ask ourselves what are or could be the most important effects on today’s investment policy.
For simplicity, we focus on the span between the 2007-2009 and the developments since 2019. It may be worthwhile to look at the sequence of the two crucial periods in order to draw appropriate lessons for the future. Here are our key findings:
- The periodicities between the respective “high” and the subsequent “low” do not represent coherent fluctuations both in magnitude and strength.
- The variance of each individual growth phase (positive or negative) differs significantly from each other, both when evaluated on the basis of the respective index level or when adjusted to “1” on October 10, 1998.
- It should also be borne in mind that the duration of the “correction phases” varies greatly from one phase to another, both in terms of duration and scope.
- The current correction phase, due in particular to the Covid 19 pandemic and—even more so—to Russia’s war against Ukraine, has had and continues to have a corresponding impact on international trade and on energy prices (both for crude oil and gas and for various industrial products). The associated price increases have led (and continue to lead) to immeasurable price increases in consumer and industrial goods due to the reduced availability of energy, compared to all previous critical periods. The current environment remains very difficult to adequately be quantified in terms of asset allocation.
- The periodicities between a high and the subsequent low are not all expressions of coherent variations in magnitude and strength. Nevertheless, the data suggest increasingly large differences (between high and low).
- The amounts of the single phases of growth (positive and negative) vary significantly from one another.
- The length of the negative corrections varies significantly, both in terms of duration as well as intensity and size.
- The current correction phase is mainly explained by rising prices for consumer goods and energy, although public attention continues to be focused on monetary policy, especially with regard to the expectation of higher interest rates.
The thorny question on the minds of many analysts and especially financial experts is “How were we equipped in the face of this fragility” or, in more proactive terms, “How do we equip ourselves for the next phase of growth?” The fact is that the current financial environment is not easily comparable to the developments of past decades. What the future demands is that various dislocations have created or are going to create a new need, namely the urgency of “greater strategic autonomy” in many sectors of the economy. In this context, the possibility of “repatriation” of production in the semiconductor sector, i.e., in the field of technology, should be increasingly considered.
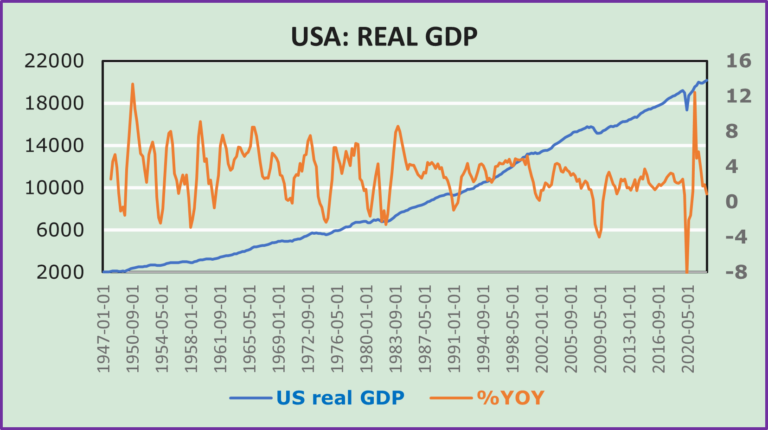
USA: GDP DEVELOPMENTS
Normally, the outlook for the stock market may be forecast as a function of growth and prospects of real GDP. The following chart shows the developments of economic activity in the USA since 1947. The chart indicates that it might not be an easy task. The chart points to three distinct phases: the first from 1947 to 1984, the second from 1984 to 2018, and the third from 2018 to Q1 2023. Let us emphasize that the current cycle (defined as the period starting in 2019) represents the weakest and strongest market growth phase.
PROSPECTS
We continue arguing that the economic outlook remains deterministic, as implied by the two stock indices shown in the chart: “DJIA & SPI Indexes”. We sense that the economic outlook should, once more, be examined in terms of the developments of foreign trade and the specific repercussions on consumer spending and investment spending. Accordingly, energy prices and, above all, the Russian war in Ukraine remains deterministic. The most difficult question concerns the duration of the Russian war in Ukraine. This is definitely a tricky question, as it could remain a most important determinant of prices, which in due course ought to influence central bank policy. Consumer`s and investor`s expectations and activities are taken to remain deterministic, subject to the Central Bank`s interest rate actions and reactions.
IMPLICATIONS FOR INVESTORS
We continue to expect a few quarters of weakish economic activity. Howev-er, a recession cannot and should not be ruled out due to the continuation of the Russian war in the Ukraine and the respective impacts on inflation and inflation expectations, as well as the interdependence with interest rates and corresponding policies.
Over the short term we continue to view equities, despite increasing volatility, as promising compared to fixed income securities. A switch may be on the cards for the period, following further increases in interest rates. On the cur-rency front, we continue to prefer our local currency over the USD and EUR. The most promising investment advice that can be given is to focus on HIGH QUALITY.
Comments are welcome.