EMR May 2022
TAKING A CLOSER LOOK …
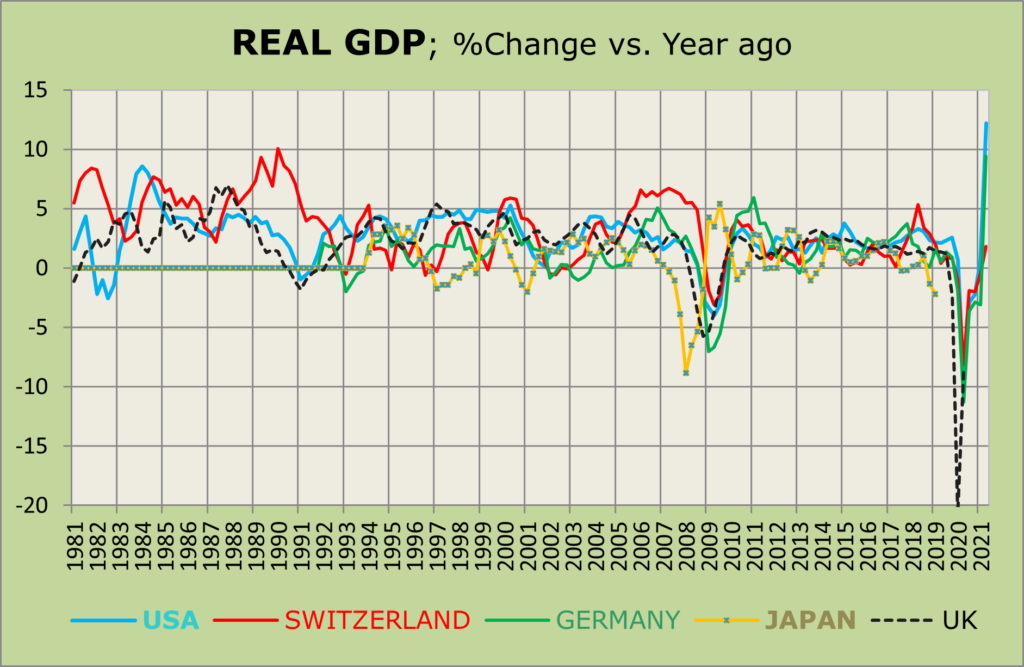
Dear Reader On the one hand, optimism reigns due to the economic growth of the leading nation, the United States, currently characterized by a consumer boom and near full employment. On the other hand, there is the language of the future, in which pessimism gives way to a spiral of geopolitical crises, a sharp rise in inflation and interest rate increases needed to combat inflation without hindering growth. Contained optimism in the United States, while in Europe and other industrialized economies pessimism prevails mostly due to Russian senseless ongoing aggression in the Ukraine.
In light of the recent rise in inflation and its impact on central bank interest rate policies, we are interested in what the best environment might be for equity markets. In this context, we will paraphrase causes, effects, and historical developments that should allow us to draw appropriate conclusions.
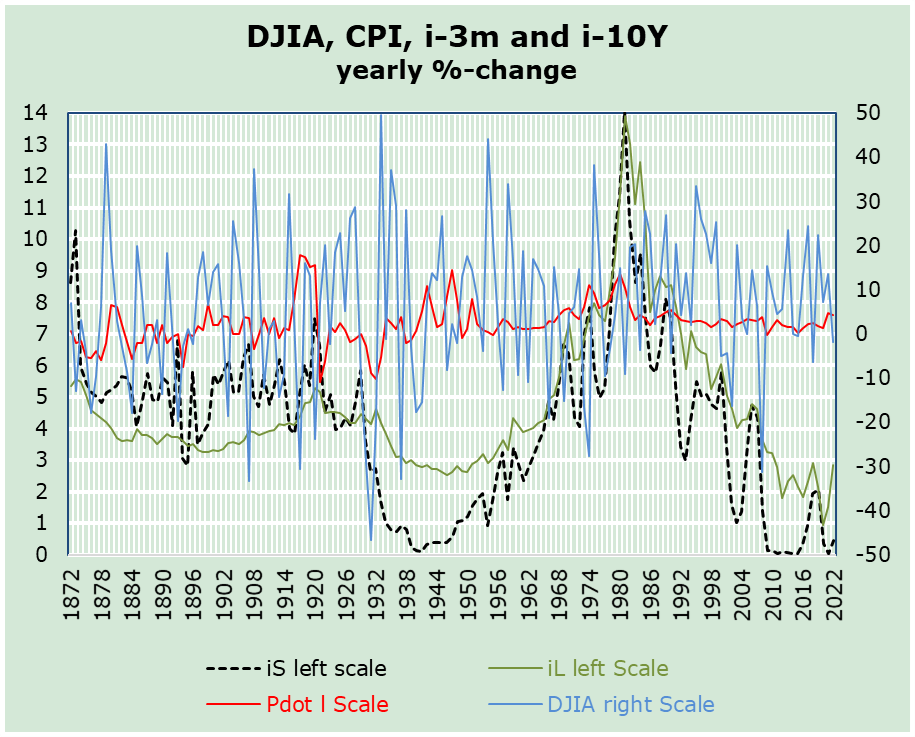
There are three promising approaches: the demand-pull, the supply-push and the most promising – the joint approach. Our deterministic assumption is that the overall political, social and economic environment remains marked by a high level of uncertainty. The world economy faces difficulties, beyond the war in Easter Europe, which concern the availability of resources both at the local level as well as internationally. The chart on the Dow Jones Index (DJIA), US Inflation and 3 months as well as 10-Y government bond yields since 1872 begs questions like what can be inferred form past developments by means of quantitative facts? From the chart – of yearly data – we might deduce the following:
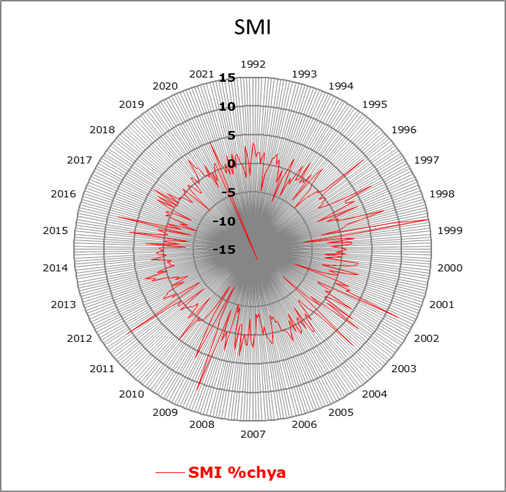
- Volatility is significantly higher for stock indices than for inflation and interest rates.
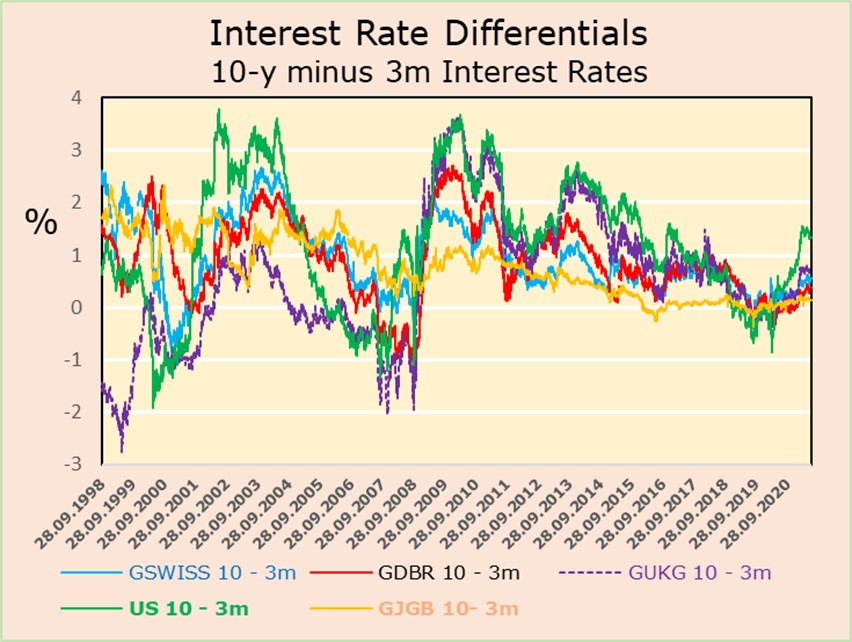
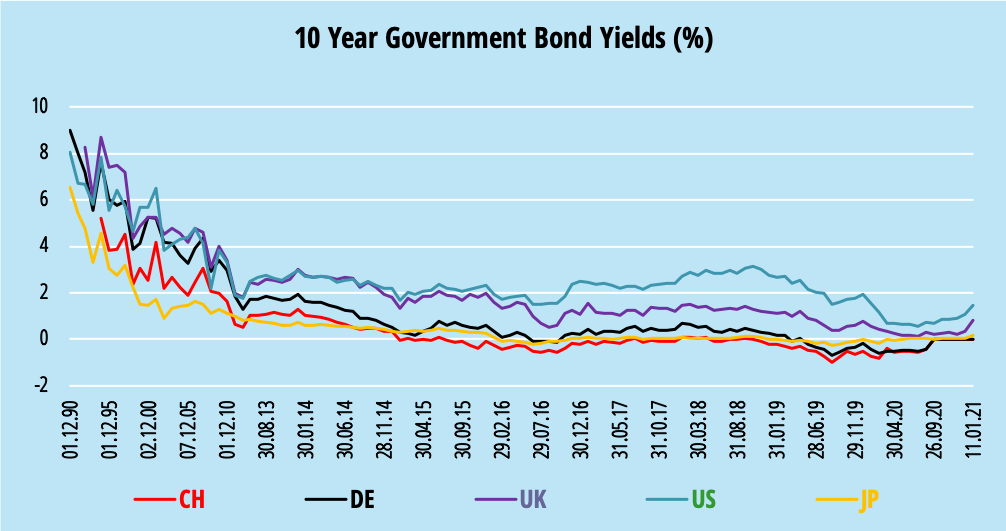
- The longer-term ups and downs of short-term interest rates are more pronounced than for 10-year bond yields. Is it fair to assume that the period we are currently experiencing will resemble the post-World War II period?
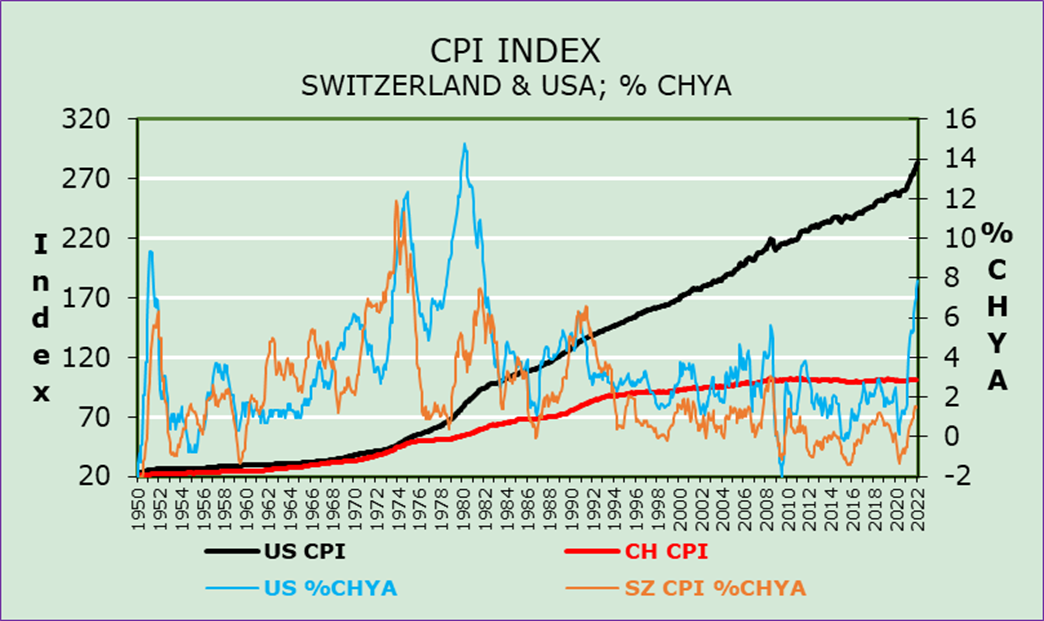
- The short-term “stability” of the inflation rate is indeed astonishing.
- What is pronounced, however, is the dichotomy between the short-term information that emerges from the hard data in relation to the longer-term assessment. We consider this dichotomy an important aspect in the current forecast because it implies possible differences in outcomes when focusing on the demand-pull approach versus the supply-push inflation assessments.
The longer-term ups and downs of short-term interest rates are more pronounced than for 10-year bond yields. Can we assume that the period we are facing currently will resemble the period post the Second World War?
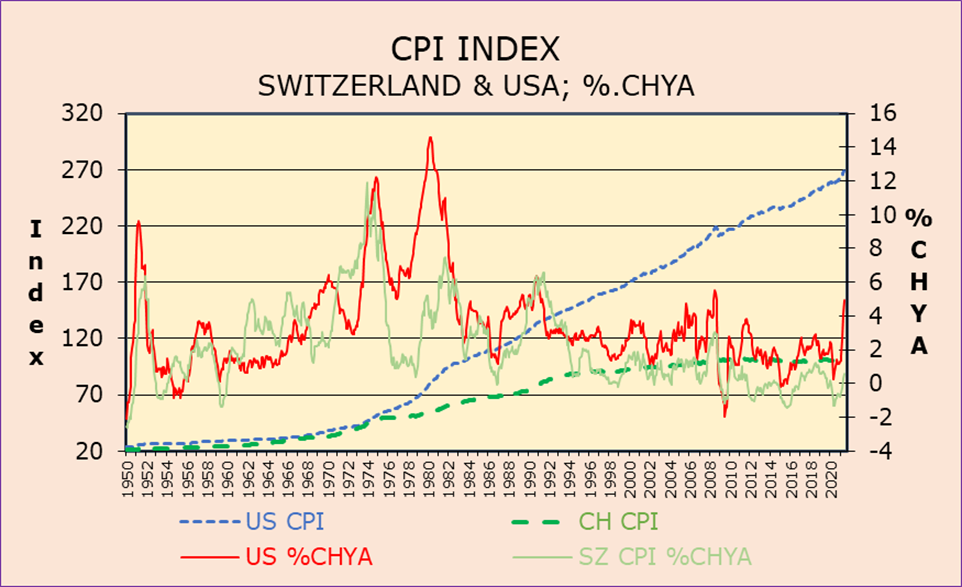
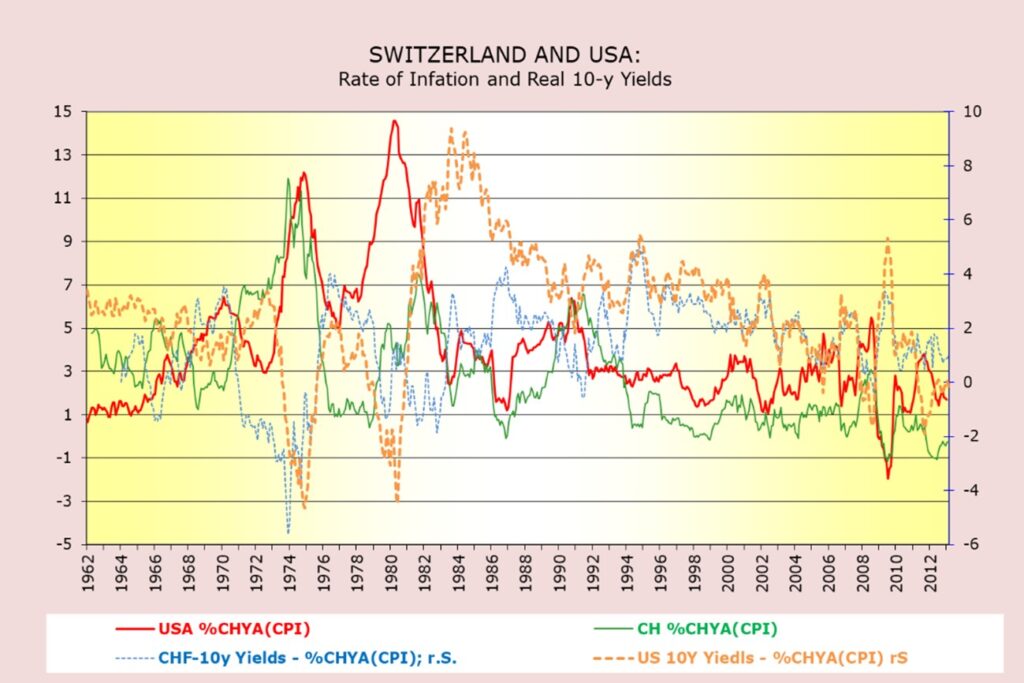
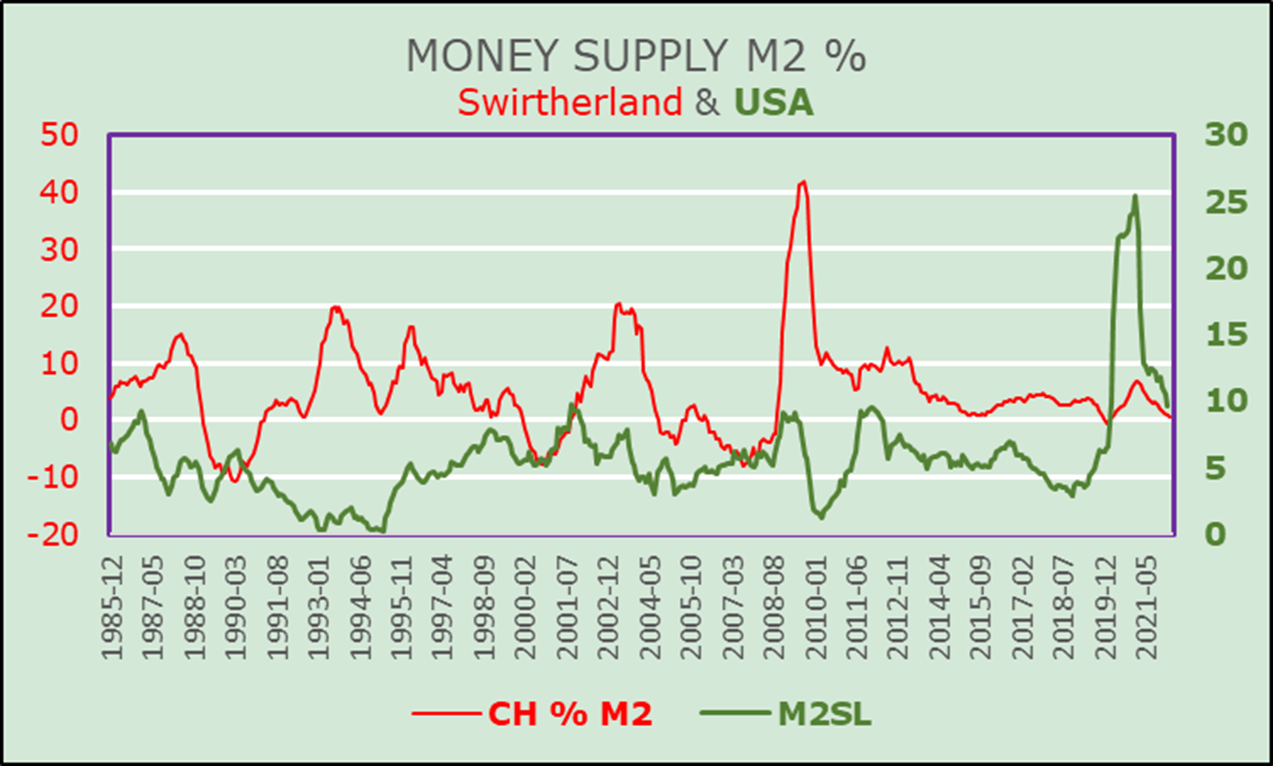
Let’s ask ourselves which factors are currently more deterministic: cost push or demand-pull factors. The correct answer is that there are many explanations why prices are currently rising. In other words, we could argue that rising prices are not simply due to the expansion of money supply. Indeed, the following chart of the annual change in M2 money supply for Switzerland and the United States is interesting. The volatility of the Swiss data is much larger for the period between December 1985 and 2008 than in the U.S. for the period from December 1985 to the end of 2019. The two astonishing swings and corresponding corrections occurred in Switzerland from the end of 2008 to early 2011 and in the U.S. since the end of 2019. What are the factual implications of these developments? We believe that “other factors” were and are much more deterministic than money supply.
DETERMINANTS: COST-PUSH AND DEMAND PULL
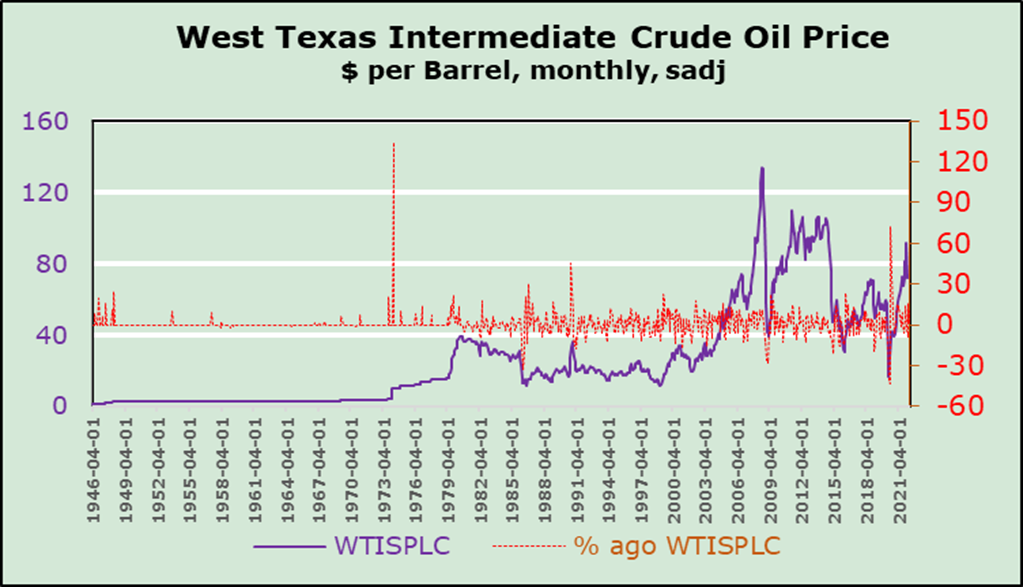
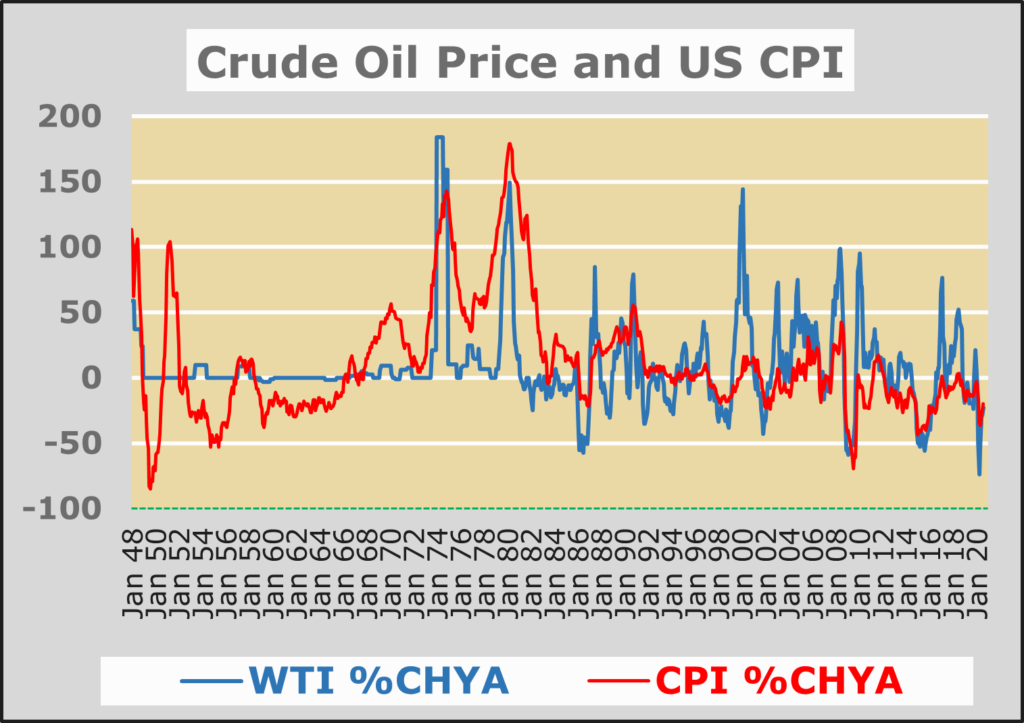
Here we do not subscribe to the widely expressed opinion that inflation is primarily due to monetary fine-tuning. No doubt the policy of Central Banks matter, and this not just as “moral suasion”. In the last decades we have encountered many reasons why prices rise and/or fall beyond movements of money supply. Currently we see that e.g., the price of crude oil increased due both as a consequence of strong supply and transportation restrictions as well as due to demand resurgence. The real question at this time refers more to supply restrictions than to demand revival. The environment is intrinsically determined by “politics” i.e., the war. The cost of labor, another source of price volatility is due to the ability of producers to arbitrarily compensate rising prices. At this juncture we find it highly difficult to quantify the interplay of “Cost-push and Demand-pull” factors, beyond and or depending of the expected or feared monetary actions. As we all known in almost all periods of history inflation has been a combination of several factors. The current specificity is due to synchronous worldwide repercussions, on the real economy as well as prices, interest rates and currencies. It must be factored in that the governmental “printing press” of recent quarters and years – in order to combat particularly the COVID-19 pandemic – must now be controlled, hopefully by means of subtle interest rate increases.
FRAMEWORK CONSIDERATIONS
Once again, we would like to stress that we are unable to determine when and how the Russian invasion and dismemberment of Ukraine will end. In spite of the unacceptable human tragedy, we should seriously consider the implications not only on the energy front but also on the food front, mainly for Europe and the whole world. Although the media mainly focus on inflation “tout court”, i.e. without mentioning the specific causes, we believe that these are expected to have a decisive impact on the allocation process.
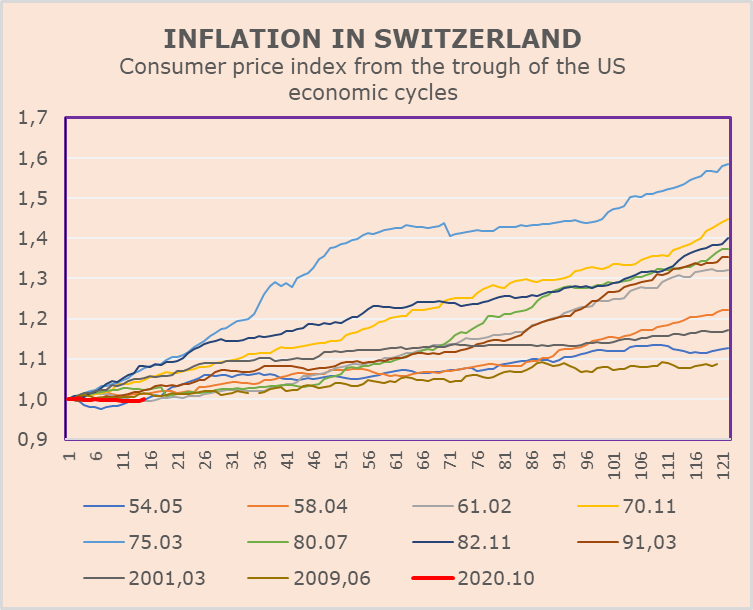
At this stage we do not see any specific isolated factors that could determine the course of inflation. We are thinking of bad weather or new epidemics. Inflation due to the war will continue to play an important role, especially – and we hope – only in the short term. Food prices must be taken into consideration at this point. They will continue to suffer as a function of the Russian invasion of Ukraine. The offer speaks of a possible increase in food prices in the medium to long term. Another reason for inflation will be the recovery of global economic activity. Inflation of the economic cycle should – at this juncture – only have a short-term deterministic value.
FINDINGS FOR INVESTORS
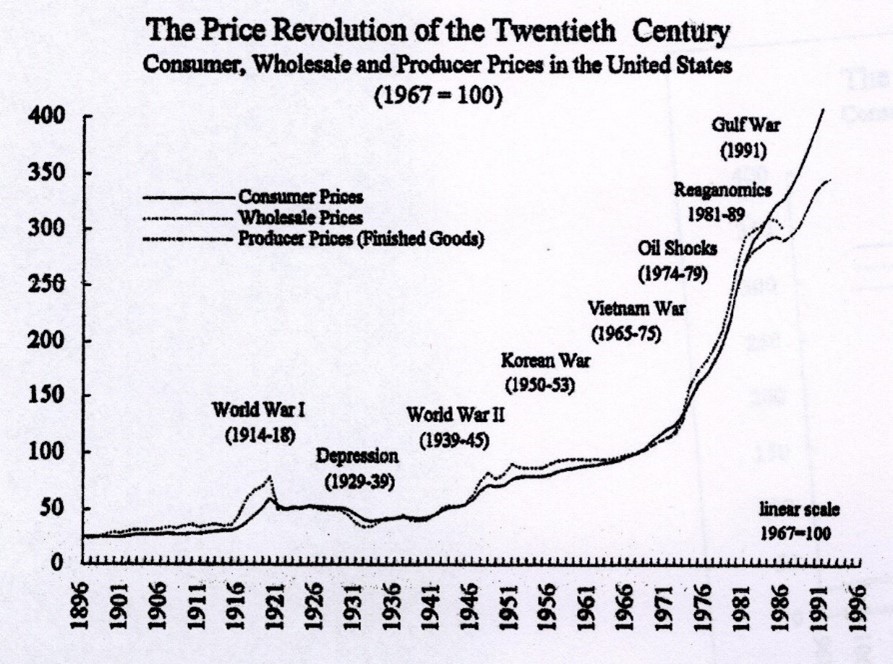
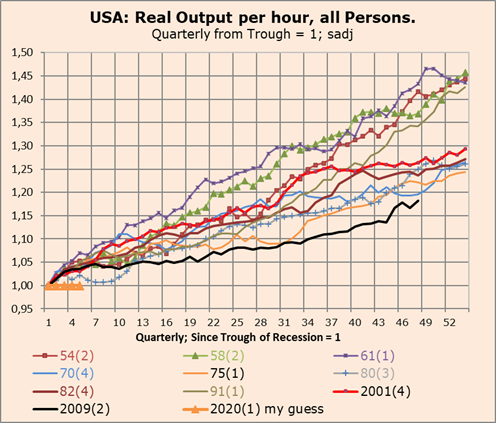
The recent ups and downs on a global scale remain difficult to permit a clear-cut formulation of a promising investment approach. In other words, the environment remains elusive. Therefore, we suggest the following approach. It is a known fact that almost all major wars have been a major cause of inflation. Should we expect that this time around it will be much different? Industrial production is not expected to yield much support to economic growth. Why? Because there are additional reasons like the Covid-19 pandemic and the national and international transportation of raw materials and intermediate goods and services.
A first consequence speaks of short-term trading. This approach suggests that daily, weekly and monthly volatility is expected to remain fashionable.
Second, sectoral rotation should not be underestimated, especially in the short to medium term. From a historical perspective, there seems to be no doubt that the current setting requires an adjustment of the profit or loss potential in constant currency.
Third, inflation at levels over 3 to 4%, together with the impending need to tighten the monetary environment to prevent inflation to increase even further, must be taken as an indicator that the equity markets ought not to be an inflation hedge instrument.
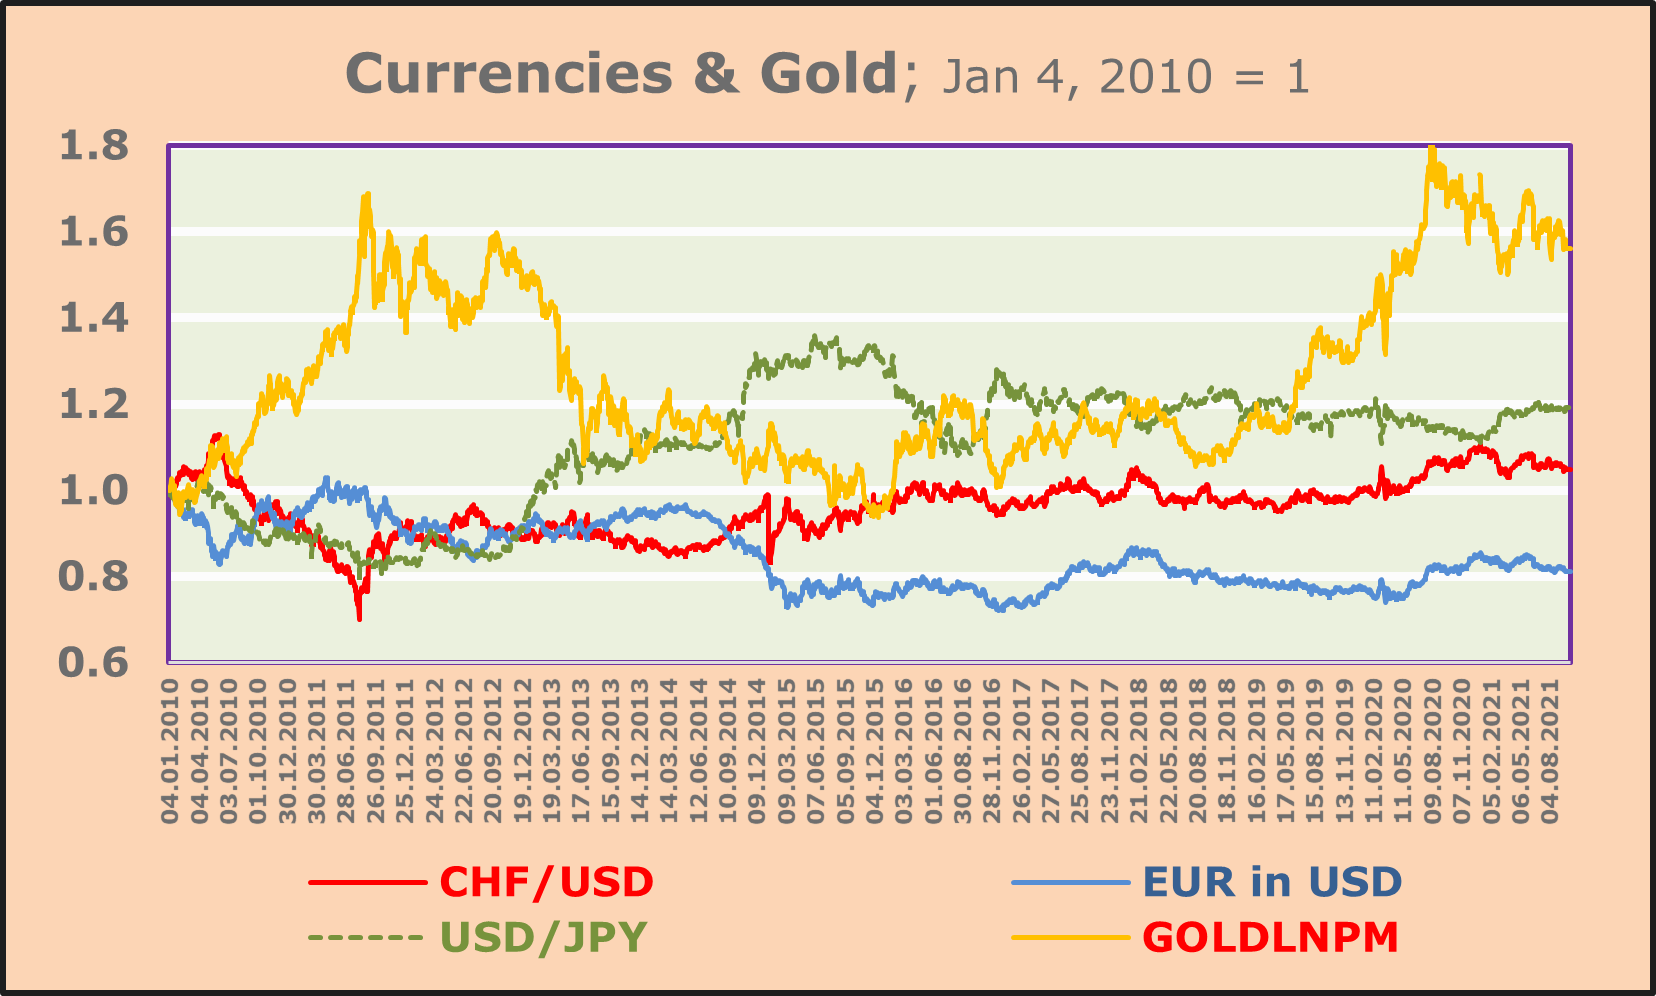
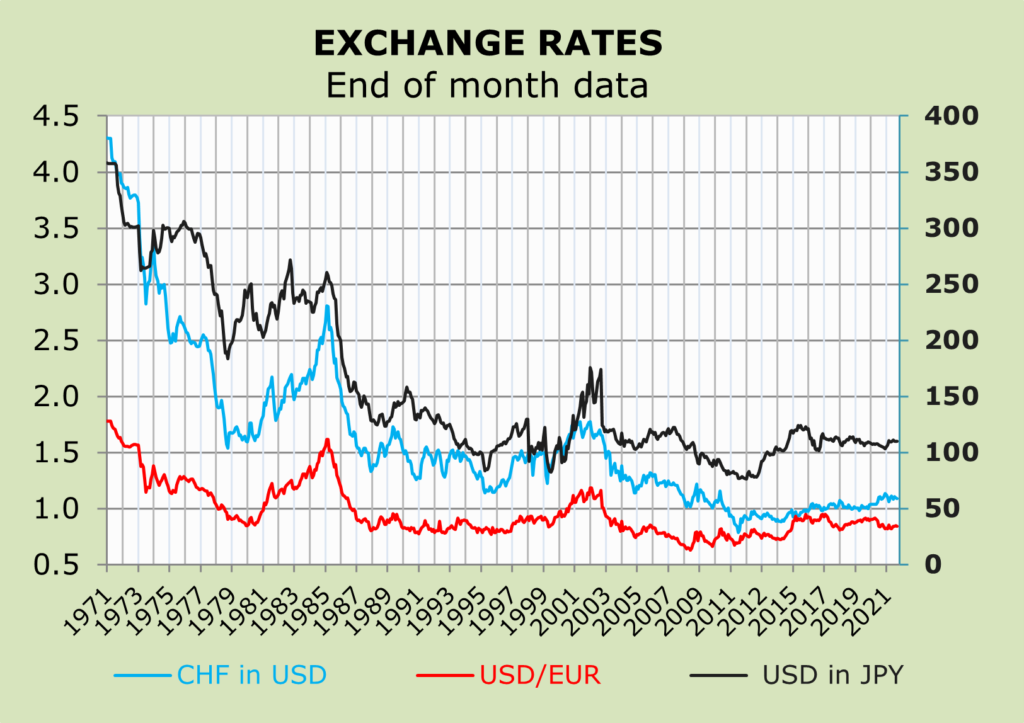
Fourth, we continue to believe that, at least over the short-to-medium term, Swiss investors should focus preponderantly on the domestic currency.
At this stage, given the recent markets´ correction we believe that investors should remain more focused on equities than on fixed income instruments.
Comments are welcome.