EMR October 2024
Dear Reader
CURRENT SETTING
We have no doubt that in recent years/quarters/months the economic discourse has undeniably focused on managing interest rates to combat inflation and, in particular to counter inflationary fears and pressures.
Indeed, fears of an imminent economic slowdown, due to a short-term reduction in consumption and investment, coupled with fears of rising interest rates as a result of central bank action, speak volumes. However, it is the strength of economic activity that, in our view, will limit the policy increase in interest rates. In this EMR we will focus on recent developments in equity indices to obtain factual information regarding deterministic factors. The following table and related graph of changes in equity indices – on an average annual basis – speak volumes about the ‘deterministic’ factors, which in our opinion have not and do not receive due attention.
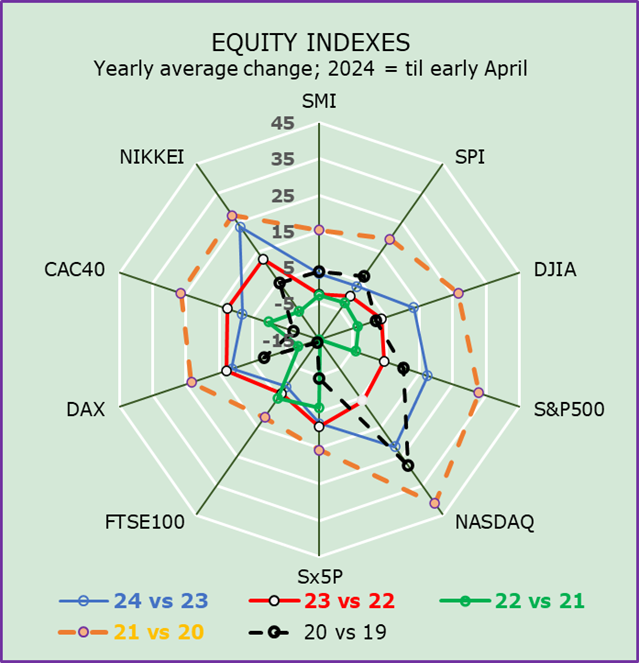
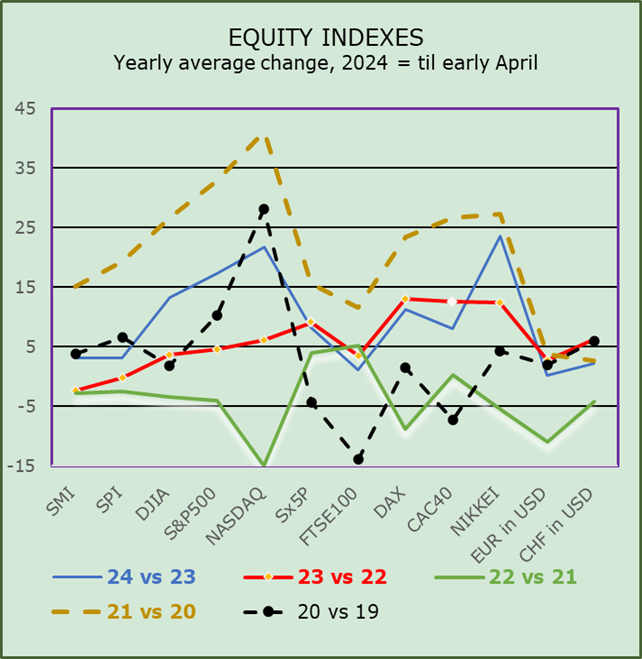
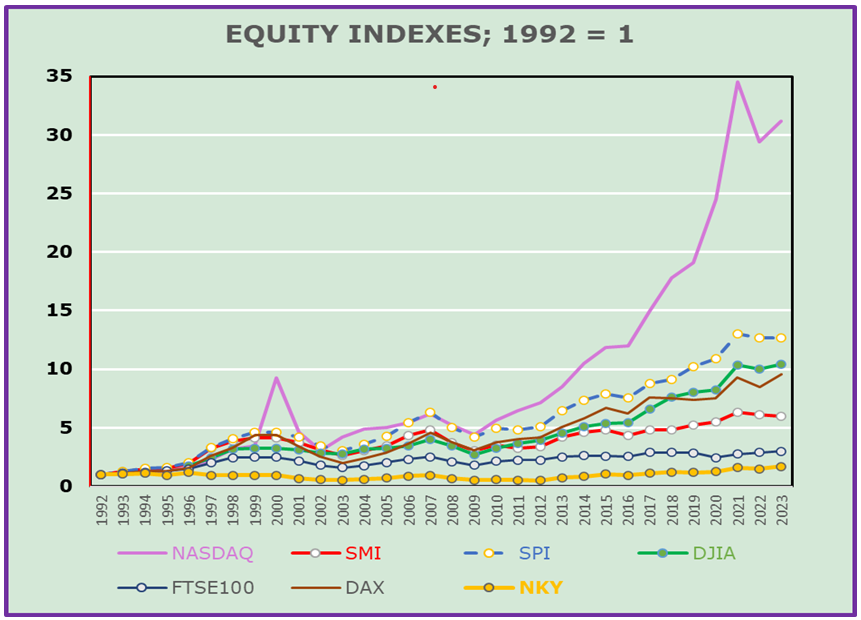
Changes in equity indices (average annual basis)


At this point, we will try to understand what the latest developments have been and what they say about promising investment prospects.
Both the table and the chart show that the highest average performance in recent years was achieved by the Nasdaq (+18%), followed by the S&P500 (+13.52%) and the Nikkei (+12.66%). The worst performers were the FTSE100 with 2.42% and the SMI with 4.06%. It should be noted that the data is expressed in the respective currencies. It should be borne in mind that inflation and thus the controversial fine-tuning of interest rates by the respective central banks played a decisive role. In our view, real events require a rather differentiated action/reaction function. Furthermore, the highs and lows of the respective currencies relative to the reference currency should be taken into account when defining the “de facto” profit/loss differential. In our opinion, this is a fact that is of considerable importance in the context of an effective international comparison.
SHORT TO MEDIUM-TERM ASSESSMENT
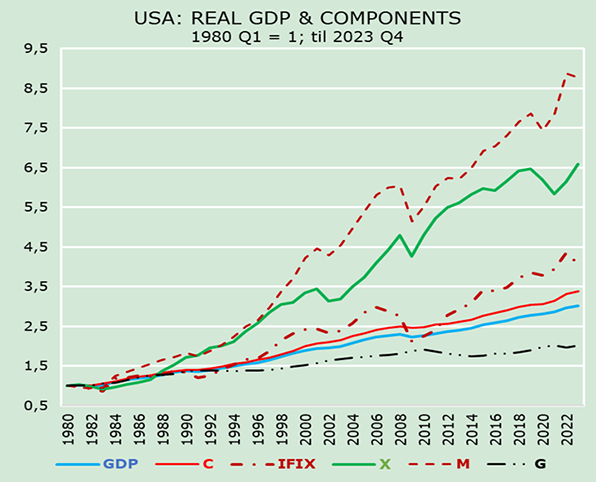
We believe that the economic shocks of the past few years (Russian war against Ukraine, Covid pandemic, and climate change) have left the global economic system in a state of unexpected vulnerability as they have spared no one. Russia’s war against Ukraine underscores the “unexpected” dependence of the free world on energy imports, pushing inflation ever higher, with unexpected implications for monetary policy, expected economic growth and so on as primary determinants of inflation flow. The difficulty we encounter in this transition is the quantification of the impact on overall economic growth, inflation and interest rates. The authorities’ “one-sided” focus on adjusting interest rates to dominate inflation is difficult to explain with sufficient precision.
The U.S. presidential election is another tricky question mark. Both in regard to who will be elected to the presidency for the next 4 years as well as which policy he/she will try to implement, representing a “new” deterministic factor that is very difficult to quantify with sufficient precision in the short- as well as the medium term. We ask ourselves:
- What political measures could the person that wins the election take, and
- What impact could this have on the national and global economy?
If we focus on the data in the table and chart shown above, we should consider the different impact of inflation management on each stock index. In this context, the performance of the NIKKEI index is puzzling compared to all other indices except the NDX. There is no doubt that the trend shown points to a stronger “retracement” of technologically advanced products.
What is not obvious are the impacts of and on the currencies and thus on the country allocation, as shown by the rather low growth of the SMI (Swiss Market Index) compared to all other indices in their respective currencies.
Accordingly, we maintain a rather restrictive country allocation based on technological innovation and financial management capabilities.
We believe that the outcome of the US elections will have an impact on investment policy in the coming months and quarters. This means that greater attention will need to be paid to volatility, economic expectations and interest rate management by monetary authorities.
Suggestions are welcome.